To say value investors have had a tough go over the past few years is certainly an understatement.
Of the last 12 years, growth stocks have outperformed value stocks in 10 of those years. This time period represents growth investing’s great run.
If you purchased the S&P 500 Growth index at the beginning of 2007, you would have gained 262% including dividends. That works out to about 10.4% annualized over the time period, which includes the 2008 financial crisis.
Still, if you opted for the value index, you still made money, just not as much – it rose 132% or 6.7% annualized. Clearly there was a right and a wrong choice over the past 12 years as it pertains to style.
S&P 500 Style Indices: As we will be referencing the S&P 500 Value and Growth indices within this report, let’s start with a little context. Style investing comes in many shapes and sizes, but the biggest and most widely known are arguably growth and value stocks and indices.
Growth stocks and indices attempt to capture companies that are growing earnings or sales at a faster rate than the average.
Value stocks and indices, on the other hand, are focused more on companies with cheaper valuations than the market, often based on Price-to- Earnings or Price-to-Book ratios.
The S&P 500 style indices split the index members into growth and value cohorts. However, companies that contain characteristics of both or are not as clearly defined, can be included in both the Growth and Value index. These indices are also available as ETFs including from either State Street (SPYV & SPYG) or from BlackRock (IVE and IVW).
Growth companies often fall into the momentum style category as well, while value companies are often higher dividend payers.
Chart 1 below tracks the S&P 500 Value and Growth indices since 1995 and the orange line is the relative performance of value stocks versus growth stocks. A falling orange line means growth is winning.
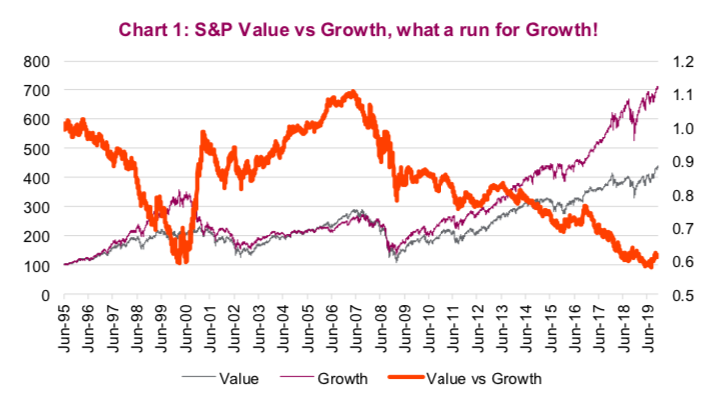
You may have noted a slight uptick in value shares over the past few months (Chart 1). This of course begs the question, after so many years of underperformance, is it value’s turn to shine? Maybe. But first let us dig a little deeper into when each typically outperforms, whether there is a valuations angle and what exactly is value and growth (it may surprise you).
Time for value or time for growth – neither is superior
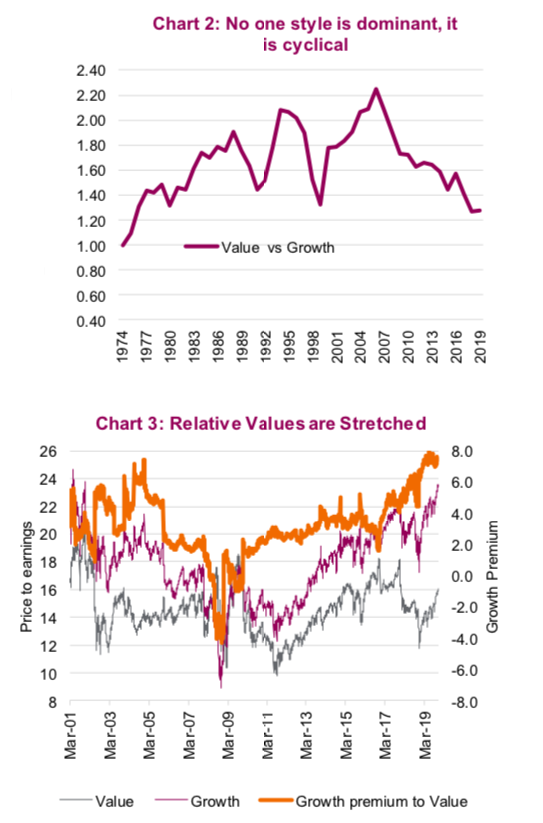
The one lesson that time has provided is that the winning style often wins for an extended period of time and then the other style wins. You can see that partially in Chart 1: growth won in the late 1990s; value in 2000-2006; then growth again from 2007 until 2018. For the record, 2019 is roughly a tie with a few weeks left to go. But if you take a longer look back, starting with 1974, when we first started seeing style index data, the cyclical pattern is clear. Chart 2 belwo is the annual relative performance of the S&P 500 Value and Growth indices. Value dominated 1974- 1988, 1992-94, 2000-2006, while growth won from 1989-1991, 1995-1999 and 2007-2018.
Valuations sort of matter, market environment matters more
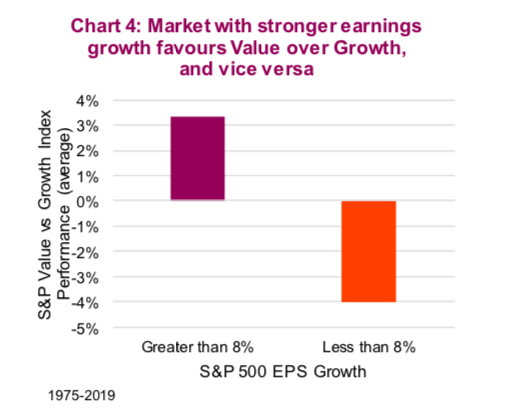
Today, the S&P 500 Growth index is trading at about 23.6x earnings (PE ratio based on consensus earnings estimates for the next 12-months) which is expensive by historical standards and very expensive versus value’s PE ratio. The S&P 500 Value index is trading at a more reasonable 16x, roughly in line with its 20-year average. Chart 3 above clearly shows that growth is trading at rather elevated valuations compared with value, with a PE premium of about 8 points.
However, we have found a few noteworthy nuances in the history of valuations as it pertains to style outperformance. First, going back farther, the premium valuation of growth reached much higher levels than 8 points. And extremes don’t seem to line up with periods that you should switch from one style to the next. The exception is when you come across a market environment when the growth premium is very small (0-2 points), it is simply time to buy growth.
Earnings growth and nominal GDP growth matter more.
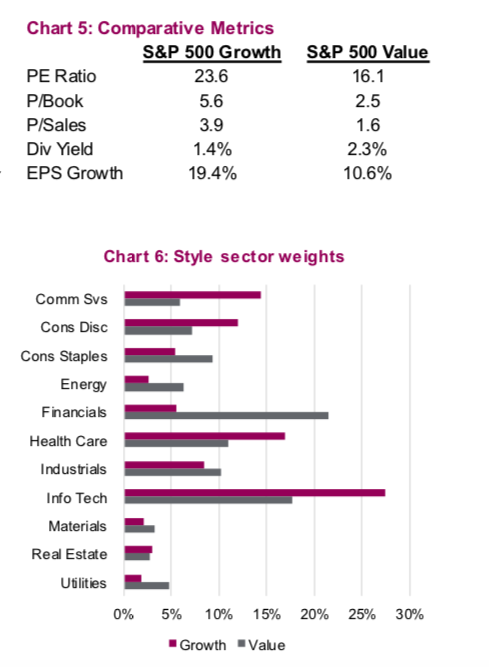
When aggregate S&P 500 earnings are growing at a faster pace, value stocks tend to outperform. When earnings growth is slower or negative, growth stocks tend to outperform. At first glance this may seem counterintuitive, but stick with us on this one.
When earnings growth is scarce, aggregate S&P earnings will be low or negative, and companies that are still able to grow their earnings will likely receive a premium in that market environment. This helps the growth index outperform value. Conversely, when earnings growth is plentiful, everyone is actually growing earnings. During these times, value companies that often use higher degrees of financial/operational leverage can grow earnings faster than growth companies. This gives the value index an advantage (Chart 4).
We found the same loose relationship with nominal U.S. GDP. When the overall economy is growing faster, you have strong total earnings growth, benefiting value. And when economic growth slows, growth companies reap the benefit due to scarcity.
What is value or growth – Know what you are buying
Value stocks by definition are those that are considered comparatively underpriced or overlooked. With markets continuously making new all-time highs, value has also done well recently, but the recent reversal in fortune of the S&P 500 Value Index has been led largely by Apple. Yes, Apple is not just in the value index, it is the largest position.
Other names like United Health Group and General Electric along with the banks, have also helped contribute, but in terms of pure attribution, Apple is the clear leader in the quarter to date. Apple makes up 8.9% of the index, compared with just 4.2% in the S&P 500. The next largest weighting within the index is JP Morgan at 3.4%. Somehow, buying Apple at all-time highs hardly screams value, but any explanation requires a discussion of much larger issues like index methodology and the murky science of how to effectively isolate a factor.
Chart 5 below compares some of the key valuation and growth metrics of the U.S. growth and value indices. Comparing the two, it does appear as one would expect. Chart 6 provides a bit deeper insight into what is in each value and growth index.
Growth has more communication services, consumer discretionary, health care and technology. While value has more staples, energy, utilities and lots more financials. Digging a little deeper and the holdings within each sector diverge even more.
As the market composition changes over time, not surprising so do the underlying style indices. Perhaps the biggest change over the years as been the increasing weight of technology in the Value index. Ten years ago the S&P 500 Value index contained less than a 5% weighting in technology, now it is 17%. Then again, many technology companies today are dividend paying value names. Look at Apple, it was added to the value index in Q4 of 2018 when it was trading at about 12x. Today it is 21x, so its stay in the value index may be more of a short term visit.
There are nearly 200 individual ETFs in Canada and the United States that have “value” in their description. Each and every one of them will have varying methodologies and underlying holdings. We stress the importance of doing your due diligence into index methodology and characteristics to ensure that whatever ETF or fund you are considering aligns with your desired exposures.
Investment conclusion
As with any decision, like growth versus value, there is strong evidence supporting each side. You could argue that after 12 years, it’s time for value shares to shine. Also, the valuation premium being paid for growth shares does add more risk to buying growth over value at current levels. Earnings growth, which was low in 2019, is set to increase in 2020, this may help value outperform.
The growth argument does seem more challenging. The secular move by investors into more passive investment vehicles favors momentum/growth, which will likely continue. Growth investors could also point to things like Apple being included in value, which calls into question the decade-old approach to investment style.
In the end, if we had to choose, we would be inclined to opt for a value tilt in 2020.
Charts are sourced to Bloomberg or Richardson GMP unless otherwise stated.
Twitter: @ConnectedWealth
Any opinions expressed herein are solely those of the authors, and do not in any way represent the views or opinions of any other person or entity.


