After a -7.5% spell of manic monetary policy-induced disorientation courtesy of Chairman Bernanke’s ring of the bell at the Taper Top on May 22, the Russell 2000 has led US equity markets in a hard bounce toward new highs. Since the pullback bottom on June 24 (see our June 21 installment on the Russell emphasizing the market up-trend remained intact here), relative performance among market caps has been remarkably diffused, with the smaller the better.
16 market days later, here’s how stocks shake out:
Dow Jones Industrial Average (Symbols:YM): +6.4%
S&P 500 (Symbols: ES): +7.9%
Nasdaq 100: (Symbol: NQ): +8.9%
S&P Mid-Cap 400: (Symbol: MID): +9.6%
Russell 2000 (Symbol: TF): +10.15%
As remarkable as this general passage of market performance has been, the Russell’s 160% out-performance of the Dow is most noteworthy of all. Once again treading bravely into the dark waters of recurrent all-time highs, there’s no doubt where market leadership lies in this tape. There’s also little doubt where trouble will first appear ahead of the next pullback/correction. With that in mind let’s check in on where the Russell 2000 has gone; and where it may founder as it pushes forward.
The Russell 2000’s primary uptrend is well-intact as denoted by the white rising channel trend lines stretching diagonally across the chart below. The last 4 months have been dominated by two Broadening Descending Wedges (blue), punctuated by a support coda at the 100-Day simple moving average (green) before installing two nearly indomitable double-digit rallies (A-to-B and now C-to-D). The BDW is a classic, no-frills chart pattern that performs remarkably well, especially on a momentum breakout into new highs as illustrated twice in 2013 in the Russell.
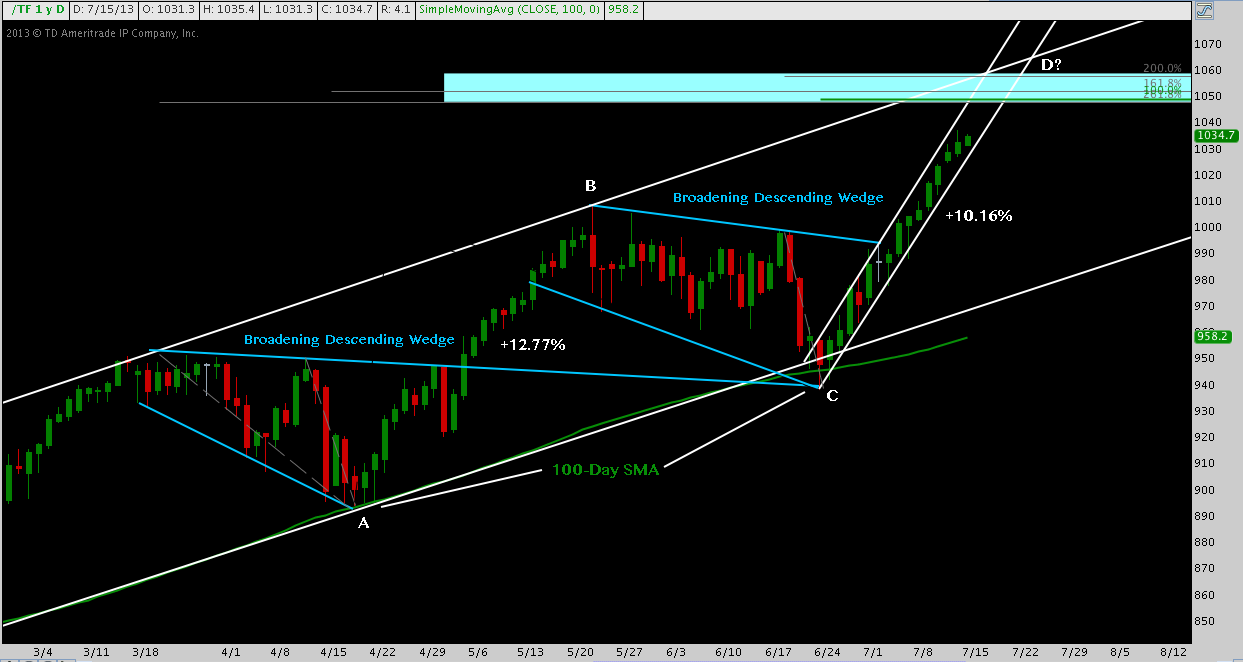
These patterns and their resulting rallies have swung the Russell 2000 from rail-to-rail through its rising channel. Now the ABCD created through off the first BDW bottom at 895 in mid-April is nearing completion amidst other cluster resistance at 1050.
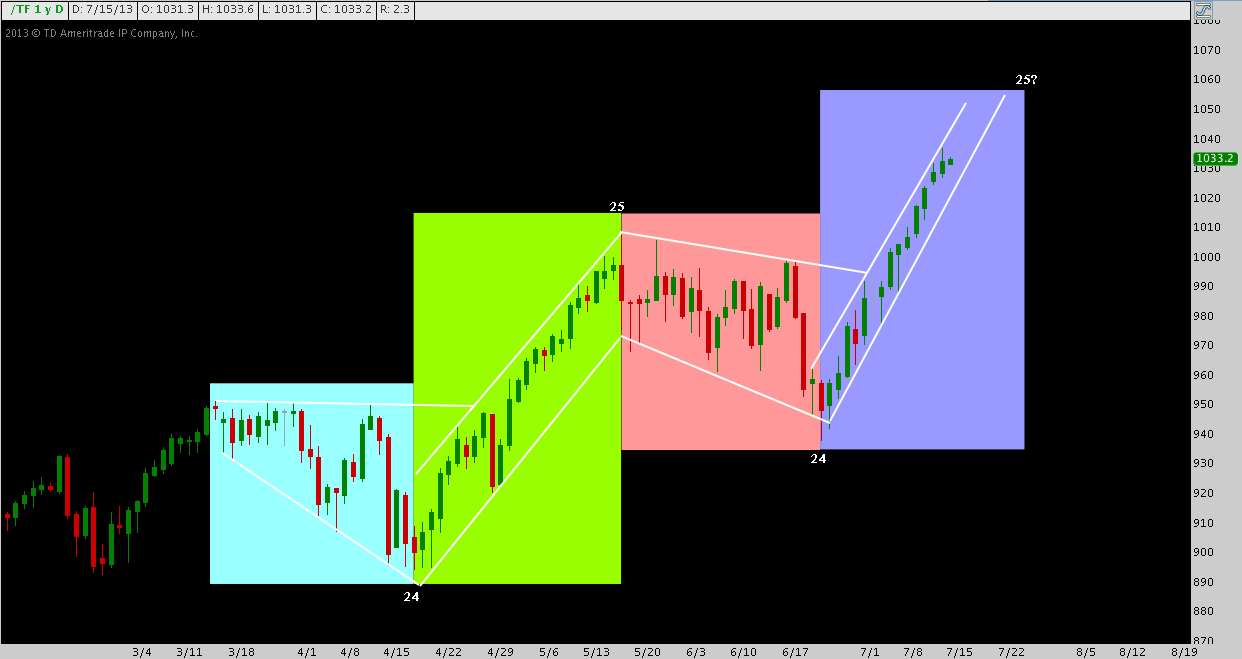
Here’s a variant view of these patterns and their outcomes: a 24 period period consolidation, followed by a 24 period channel, followed by a 24 period consolidation; and now a second channel – it’s on Day 16 (13 up days, 2 down, 1 flat). Day 25? Falls on July 26th.
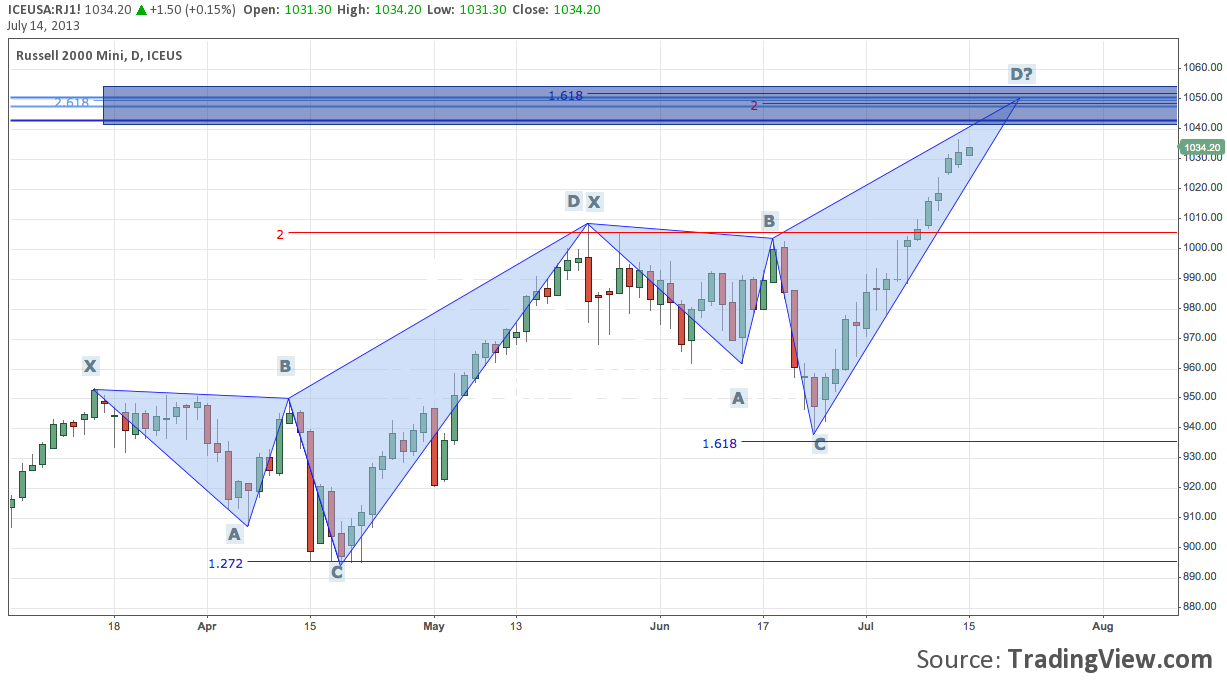
Combining these four market phases into two, a pair of highly symmetrical harmonic patterns result. The structure here is a novel one, featuring a combination of 1) a bearish shark with C as the 127.2% and 161.8% extensions of AB; and 2) a bearish deep crab with an 88.6% retracement of XA at B and extended XA extension at D (in each case at 200%). The cluster of resistance at D near 1045-1050 is significant. Here it is: the Crab Shark.
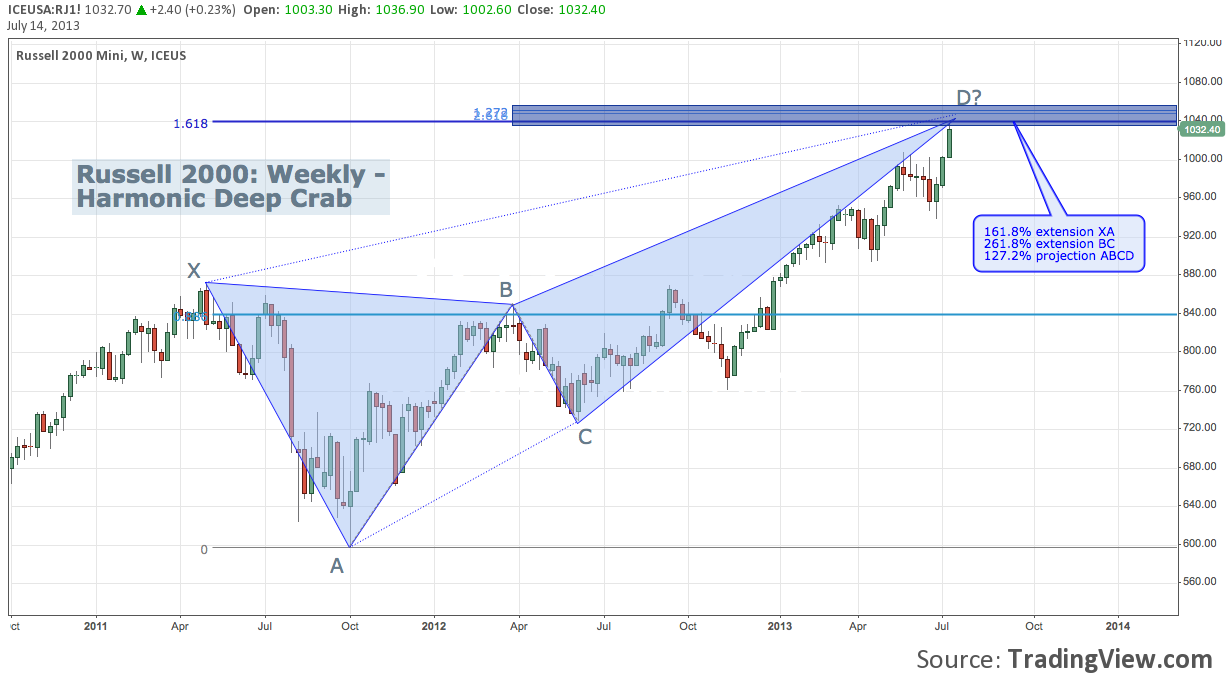
There are a few fibonacci levels in the 1050 cluster above that run off the chart and aren’t explained by these patterns; instead, they’re indicative of the cluster resistance of a 2-year Deep Crab (below) culminating in confluence with the latest Crab Shark. The range (73% trough-to-peak off the October 2011 low to present) and duration (27 months) of this pattern signal a major long-term price target and potential reversal zone is being tagged now.
Consult any timeframe: the market’s uptrend has been irrepressible and all-but-unforgiving. Where it has worked at all, shorting has only benefited the active, nimble and rigidly disciplined. Though it may seem counter-intuitive, there’s no better or more appropriate environment than now for reasoned skepticism and to subject the prevailing trend to rigorous testing to see if the long side is quietly taking on water. The above Russell 2000 charts stack resistance up just overhead (1039 on last check) between 1040-1060. After +10.5% in 16 trading days and +37% off the November 2012 lows, plowing forward full-steam toward the rocky shoals of structured multi-year resistance is enough to turn on the yellow light. While there’s no reason yet to presume the index will slip into a pullback or correction, this is yet another point at which heightened caution is warranted.
Twitter: @andrewunknown and @seeitmarket
Author holds long position in Russell 2000 futures (Symbol: TF) mentioned at the time of publication.
Any opinions expressed herein are solely those of the author, and do not in any way represent the views or opinions of any other person or entity.
: Creating Bullish Divergence?")

 and Semiconductors (SMH): Concerning Price Pattern?")


: Creating Bullish Divergence?")