One of the knocks on the stock market rally that began on September 29th is that it has primarily been led by large-cap stocks.
From the low at the end of September through the most recent highs, the S&P 500 Index rallied 13.1 percent, and the Nasdaq 100 Index 16 percent.
In contrast, the S&P 400 Mid Cap Index rose 9.5 percent, and the Russell 2000 Index 11.3 percent.
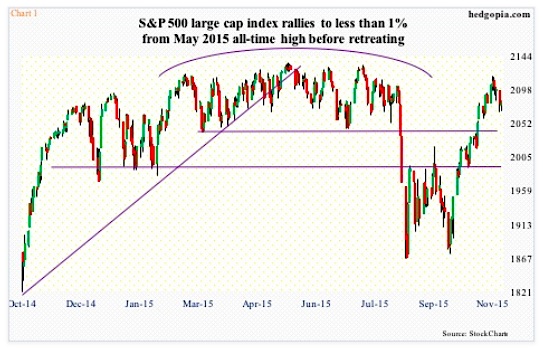
Before it started retreating on the 3rd this month, the S&P 500 was a hair’s breadth away – 0.9 percent, to be exact – from the all-time high it reached in May of this year (see chart 1 below). But bulls are still waiting to see if the bearer of large cap stocks can consolidate and rally to new highs. The jury is out (more below).
S&P 500 Daily Chart
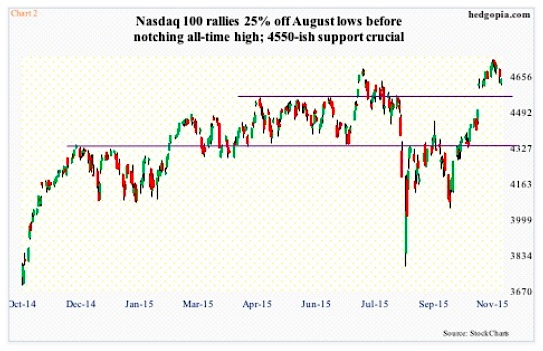
The Nasdaq 100 one-upped the S&P 500 – up 25 percent since the August low to reach an all-time high (see chart 2 below).
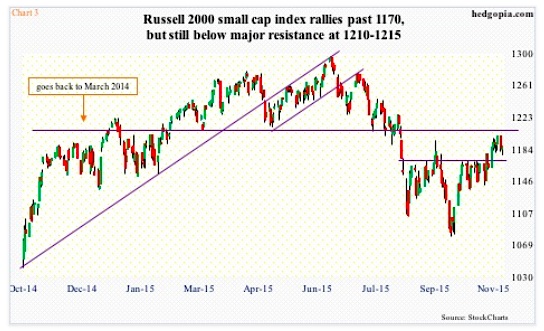
Throughout this, the Russell 2000 struggled at 1170 (Chart 3), and the S&P 400 at 1440 (chart 4 further below).
Even within the Nasdaq 100, the larger of the large-cap stocks are doing the heavy lifting. Last week, on its way to notching a new high the index rallied 1.3 percent. The top-five holdings all contributed heavily – AAPL (13 percent weight) up 1.7 percent, MSFT (7.4 percent weight) up 4.3 percent, AMZN (5.1 percent weight) up 5.4 percent, GOOGL (4.5 percent weight) up 3.3 percent, and FB (4.3 percent weight) up five percent.
Too big a reliance on a limited number of stocks narrows the breadth – that’s never healthy from the overall health perspective.
So when the Russell 2000 and the S&P 400 staged a breakout on the 28th last month, it obviously ignited a lot of talk about this belatedly confirming the strength in large-caps.
It wouldn’t be such a bad thing if money came out of hitherto leaders and moved into the laggards.
But is it too early to declare victory?
After that breakout on the 28th, the S&P 400 proceeded to test resistance at a higher level – 1455-ish – but was unable to hold it (see chart 4 next). The good thing is that buyers did show up yesterday to defend 1440, which also approximates to the 20 day moving average.
On the Russell 2000, after breaking out of 1170, it lacked the momentum to go test the all-important resistance at 1210-1215 (Chart 3). It is yet to test support at 1170. And that probably needs to happen for its own health. This level also approximates the 20 day moving average, hence may not give in that easy.
But here is the risk.
continue reading on the next page…


