The following chart and data highlight non-commercial commodity futures trading positions as of April 24, 2017.
This data was released with the April 27 COT Report (Commitment of Traders). Note that these charts also appeared on my blog.
The chart below looks at non-commercial futures trading positions for the Russell 2000. For the week, the Russell 2000 fell -0.6%.
Here’s a look at the Russell 2000…
Russell 2000 mini-index: Currently net long 20.3k, up 4.5k.
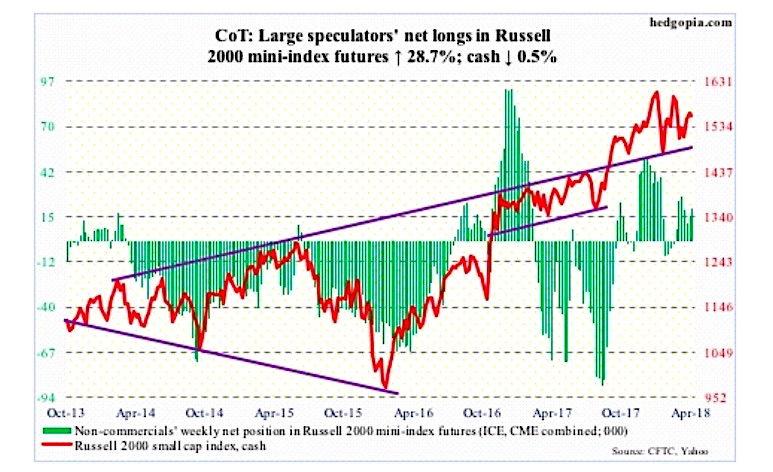
The bulls defended the 50-day moving average this week.
And the Russell 2000 Index continues to trade within a three-month symmetrical triangle, with the upper end coming into play last week. That trend line now extends to 1580s. This is the best-case scenario. Should it come to pass, shorts in all likelihood would be all over the Russell 2000.
Small-caps act better versus large-caps, but are stuck in a rut nevertheless.
In the week to Wednesday, $1 billion moved out of IWM (iShares Russell 2000 ETF), while IJR (iShares core S&P small-cap ETF) took in $127 million (courtesy of ETF.com).
Twitter: @hedgopia
Author may hold a position in mentioned securities at the time of publication. Any opinions expressed herein are solely those of the author, and do not in any way represent the views or opinions of any other person or entity.


")


")
