In my humble opinion, and as a member of the crumb traders of the world, it has come to my conjecture, that there are two types of traders in the world. Those that seek out opportunities in the market each day and those that have somewhat of a reasonably small portfolio/watch list. Each with their own pros and cons, I choose the later of the two and actually watch for and trade only one market. One market? That’s correct, you heard that right. Whatever your opinion may be, I’m okay with that and it is through knowing one market (and knowing it well) that I have come to reason that I can actually talk with some authority and expertise, a master of sorts on how the TF index moves. This is the mantra that I stand on day in and day out. Know one thing and know it well. While my strategy can work on any time frame, chart or market, every market has its trading style and unless you are familiar with it, your losses can mount.
I teach a strategy that can be used on any chart. Any time frame. Any Market. And as a trend trader, I choose the E-mini Russell 2000 Futures (TF) of all the 4 indices as it tends to move in greater ticks than any other and with some control on most days that makes the probability greater of being in a trend trade. It is with this in mind that I would like to share with you the current picture of the TF and where the greater probability may be based on technical setups. Of course this is all reflective as a representation of 2000 small cap companies.
Suffice to say, the market can do anything it wants to on any given day. I’m always ready in either direction. No bias. Just looking where the least riskiest entry may be.
Back in the start of September, after a long summer with average volume, it was the TF with increased volume that led the other four indices on a sell off. With the indices in tow, the TF found its bottom, and managed to turn the price action back to the upside, rallying up near its September highs before trading sideways for the past month. In sum, it took 1 month to drive south, 1 month to bring it back up and now we’ve chopped sideways on lower than average volume. Does this make the index non-tradable? Absolutely not. The obvious for me is that if the macro view of the index on a scale of daily-monthly appears to be in an uptrend, than any intraday trade may have more strength to it based on my trading plan. This is not to say, I’m not willing to trade in the opposite direction of the big trend. First rule, I let the bias go of where I think the market should be headed. This can cloud my intraday position if I let myself think that it should be going up because….well there is actually no reason. I simply trade the charts in front of me. No research needed.
The technique of looking for the intraday trade can be used on the daily, weekly or monthly chart. The Russell 2000 (RUT) and iShares Russell 2000 ETF (IWM) play there part in the direction of the trend for TF. It is for this reason that every week I review the macro view to look for the opportunity on an intraday entry, whether day or swing, for increased probability for profitability. Click charts to enlarge
Daily View
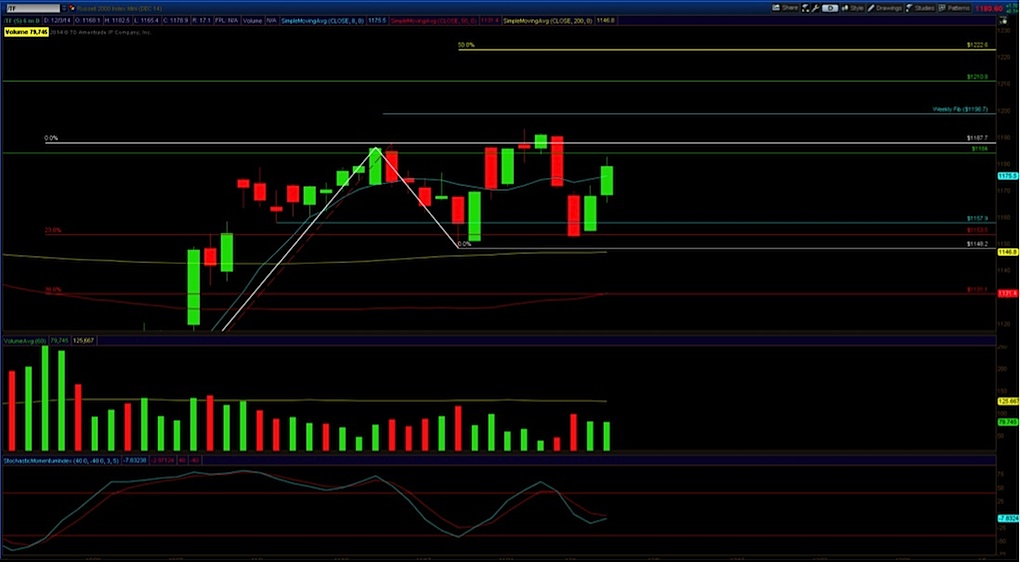
The TF (IWM/RUT), unable to break to the upside, and hold with some conviction at the most recent high in September at 1184 leaves us in a state of unknown and decision. Several day attempts into the end of November failed to move it upside and since has chopped. With volume below the 60 period moving average and price/momentum fluctuating almost weekly, the best setup from a technical perspective on my chart is a Fibonacci extension drawn on a fib retrace of 23%. What does this mean? If price crosses the 5 period moving average and holds above 1184, there is an 85% probability of getting to 1222.6. Of course along the way, some key lines in the sand including weekly fib level at 1198.7, all time daily high of 1210.8. These levels only if we can break above 1184. Key entry, whether swing, daily or intraday would have a greater probability if the price action sees a close above 1187.7; Point B of the fib extension on a 23% fib retrace. The trading rule that I don’t enter a trade on any fib extension of 23% until the breakout of the high reduces my risk.
You ask, well what if this completely turns around? That’s why I have a stop in play at point C.
Weekly View
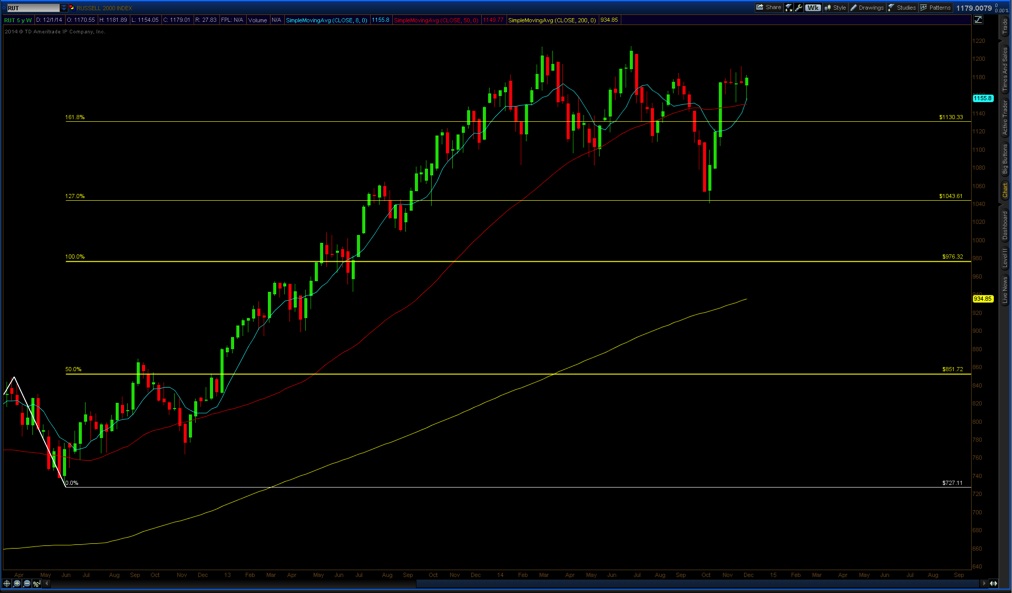
Reaching each level of the fib extension, the RUT/TF and IWM are finding support at the 127% level after reaching the 161.8% fib extension. In tow with the daily chart, if able to break above the highs, the 260.8 extension becomes valid as an upside target. The daily target of 1222.6 has the highest probability.
Monthly View
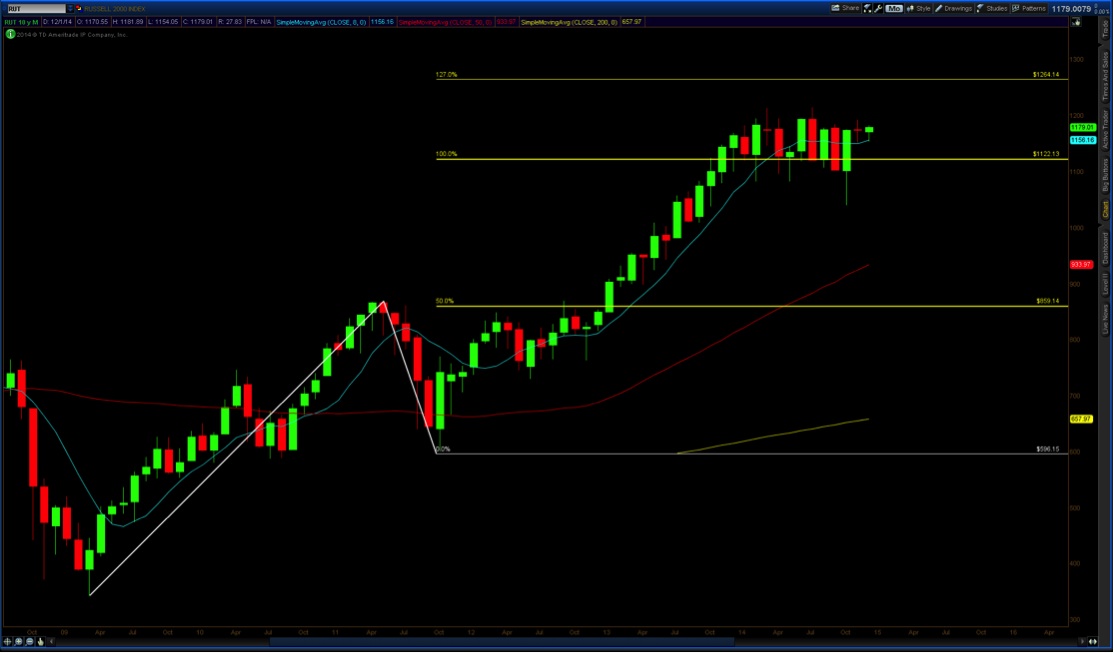
The RUT/TF and IWM have struggled at this level. Unable to close with some strength downside or move downside and hold, clearly indicates to me of some significant strength to keep the status position. 112.7 on the TF has been the key line in the sand.
While the Fibonacci targets give me a perspective and target of where price action may lead, it is with the moving averages and Heikin Ashi bars that confirm that direction on both a daily an intraday basis
Daily Chart – 5/34 EMA with Heikin Ashi Bars
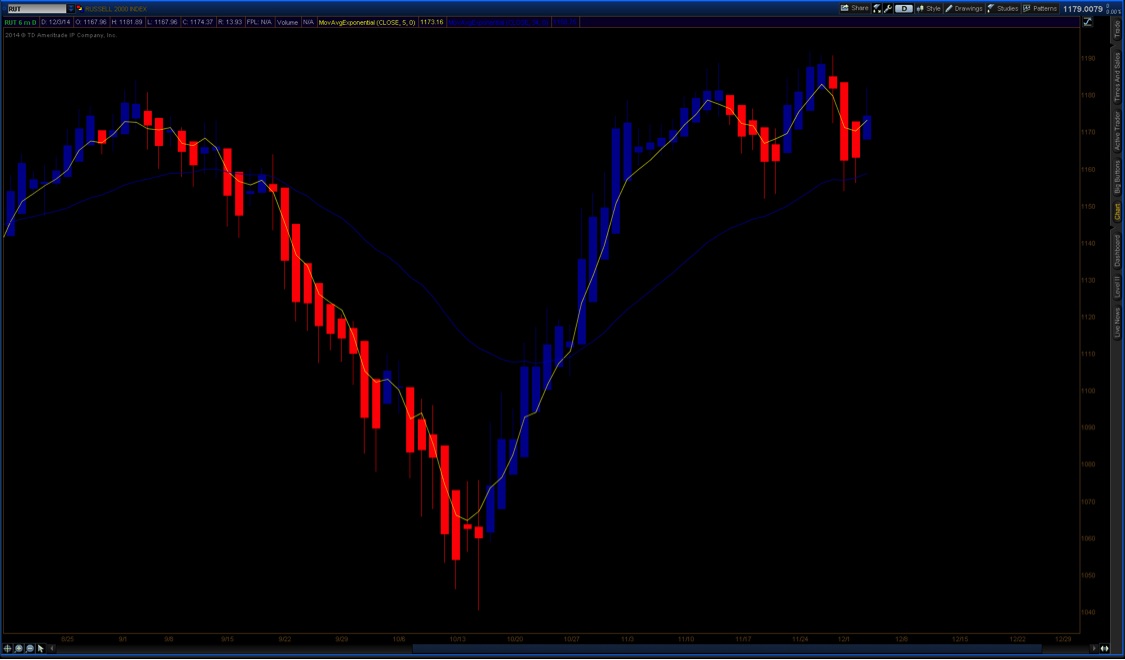
The RUT index on a 5/34 Exponential moving average chart, clearly indicates to me that the Russell is still and maintains to be in a confirmed uptrend. While it took some time for the 5ema to cross the 34, early entry on the Heikin Ashi bars in trend to the upside would have warranted greater profit. As for the use of the daily chart, the chart here finding support on daily bars of the 34 moving average, supports the fib target above at 1222.6 and higher on a weekly and monthly.
Index ETF’s
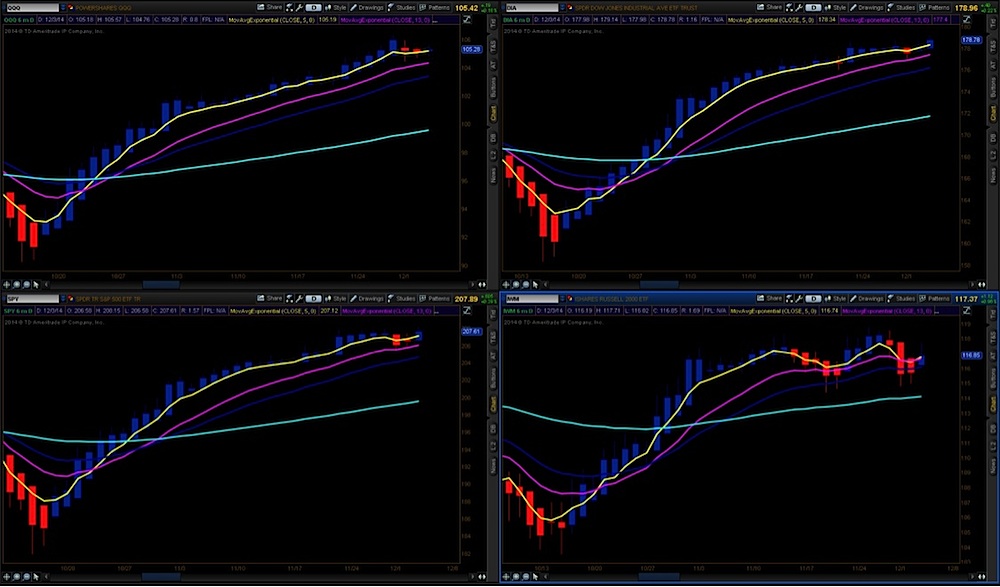
I hope that I have clearly made the view that the overall trend continues to remain upside in this market as we can see all 4 indices on the perspective ETF’s are in trend on a Daily Chart.
100 Tick Range Chart – IWM
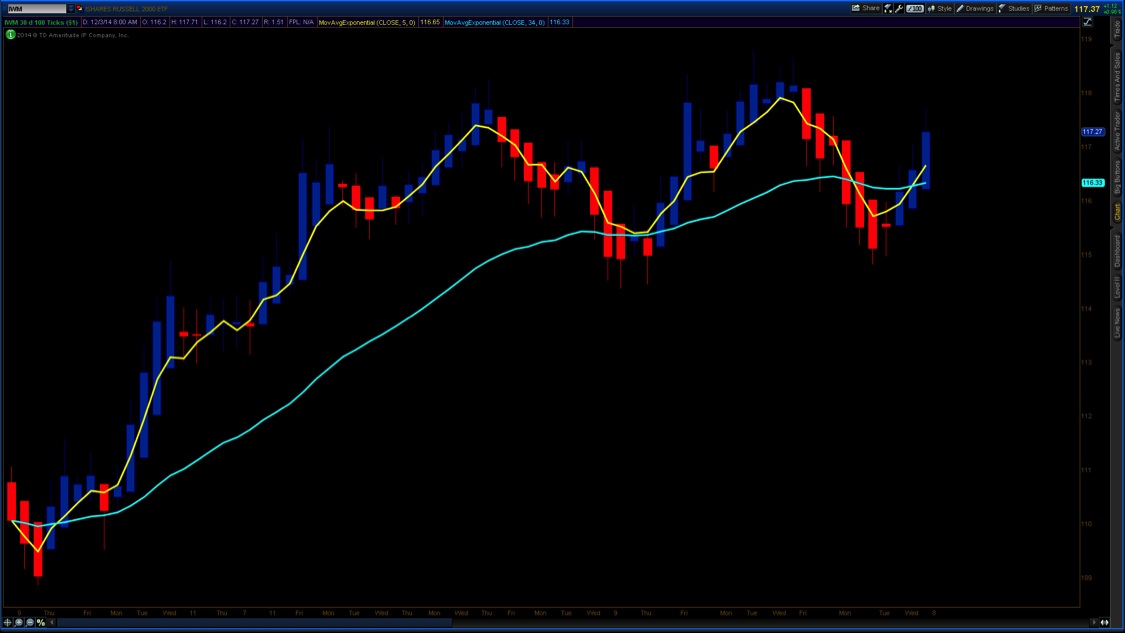
With the tradable IWM 5ema (exponential moving average) above the 34ema, with only a slight pullback to offer another opportunity for re-entry continues to support my confidence that the trend remains bullish.
100 Tick Range Chart – IWM
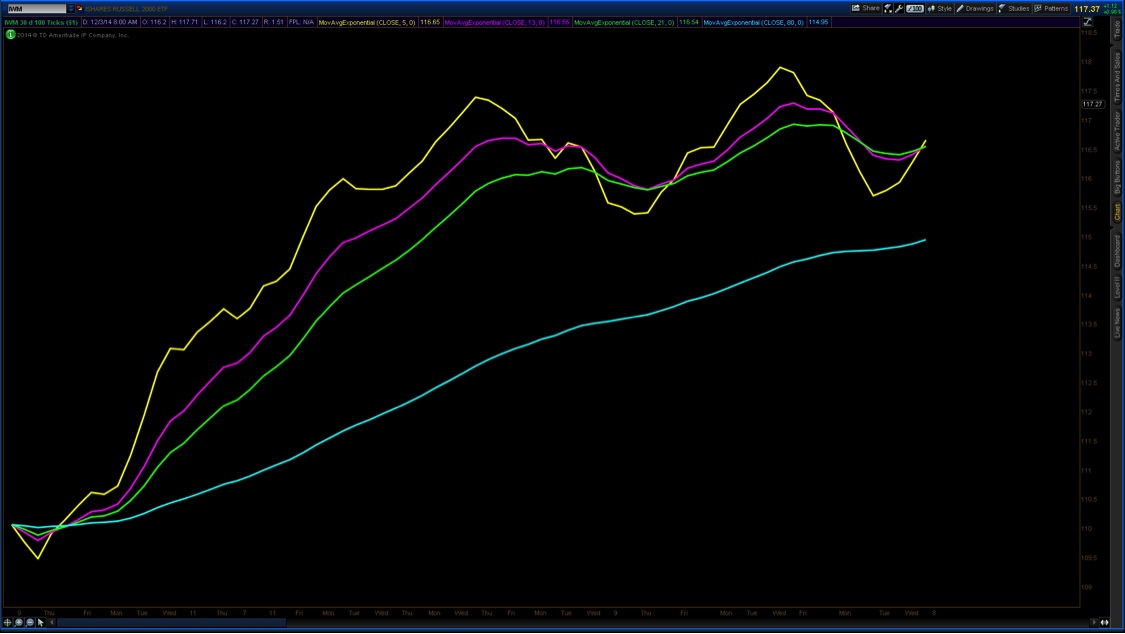
Throw in a chart of the index without bars, but to show evidence of the average lines in unison, can easily keep you in the trend. Here seen back from the entry in late October when the market turned around, the crossover of the 4 moving averages was a strong enough indicator to keep you in longer than just a day or two. With the most recent chop, I look for the average move lines in combination with the Fib extension for the strongest combination possible and highest probability.
Where does that leave us as 2014 comes to an end, contracts rollover and 2015 looms ahead? I don’t profess that I have any idea where the market is headed on any given day. The TF/RUT/IWM direction is clearly in trend by the simplest of indicators. Waiting for the breakout above Point B (1187.7) to the 1222.6 target reduces my risk. What do I want in combination? A moving average chart that is unison with 1 moving average stacked on top of one another and to support the trend action, a Heikin Ashi bar in trend as well. The intraday setup to look for as the index rolls up, as long as the big pic is all in unison, you simply look for the same setup on a smaller time frame with the 5 above the 34 and 5 above the 13/21 and 80 on a trending day where market internals support a bullish trend.
With that said, and no crystal ball, the Russell 2000 Index has the greatest probability of continuing higher on a technical entry if able to confirm on all charts that price action is indeed in a bullish trend. If price action breaks the 1148.2, I re-evaluate and wait patiently for the next setup. Past performance is no indicator of where tomorrow may be. Half of us will get it right. Half will get it wrong. That’s what makes a market.
So as much as some of you may want this market to correct itself more, the trend guides my trade. It doesn’t matter to me. The chart on the right is blank for a reason. Consider it a game of cards. You may have an idea of what cards will be laid out next if you really know the game well. You can play your hand based on all your experience and learn to take your losses small. In the end, you have no clue what that next card is. You are the expert at that one game. Not all games, just that one. (Perhaps this is why poker players make good traders?) This is why I trade one market and one market only. Not one single person knows where the next bar will go. It’s all about reducing your risk and increasing your probability that it will go in your direction. Trade with a stop and you reduce your risk. Learn to manage the trade and you will increase your profitability. You can read more from me on my blog TradingFibz.com or find me on Marketfy.com. Wishing you the best of trading.
Follow David on Twitter: @TradingFibz
Author has a long position in IWM at the time of publication. Any opinions expressed herein are solely those of the author, and do not in any way represent the views or opinions of any other person or entity.


