By all accounts, the season of stock market summer doldrums is nearing its peak as the languorous volume and lackadaisical trading characteristic of holiday trade generally pervades each passing session.
Will this continue until after Labor Day, when Wall Street’s seasonal Bigfoot (that hideously wealthy PM who sits the entire Summer out somewhere in the Hamptons) is rumored to return each year? Or maybe until Septaper is confirmed (or not) at the conclusion of the next FOMC meeting on September 18? And what about German elections on September 22?
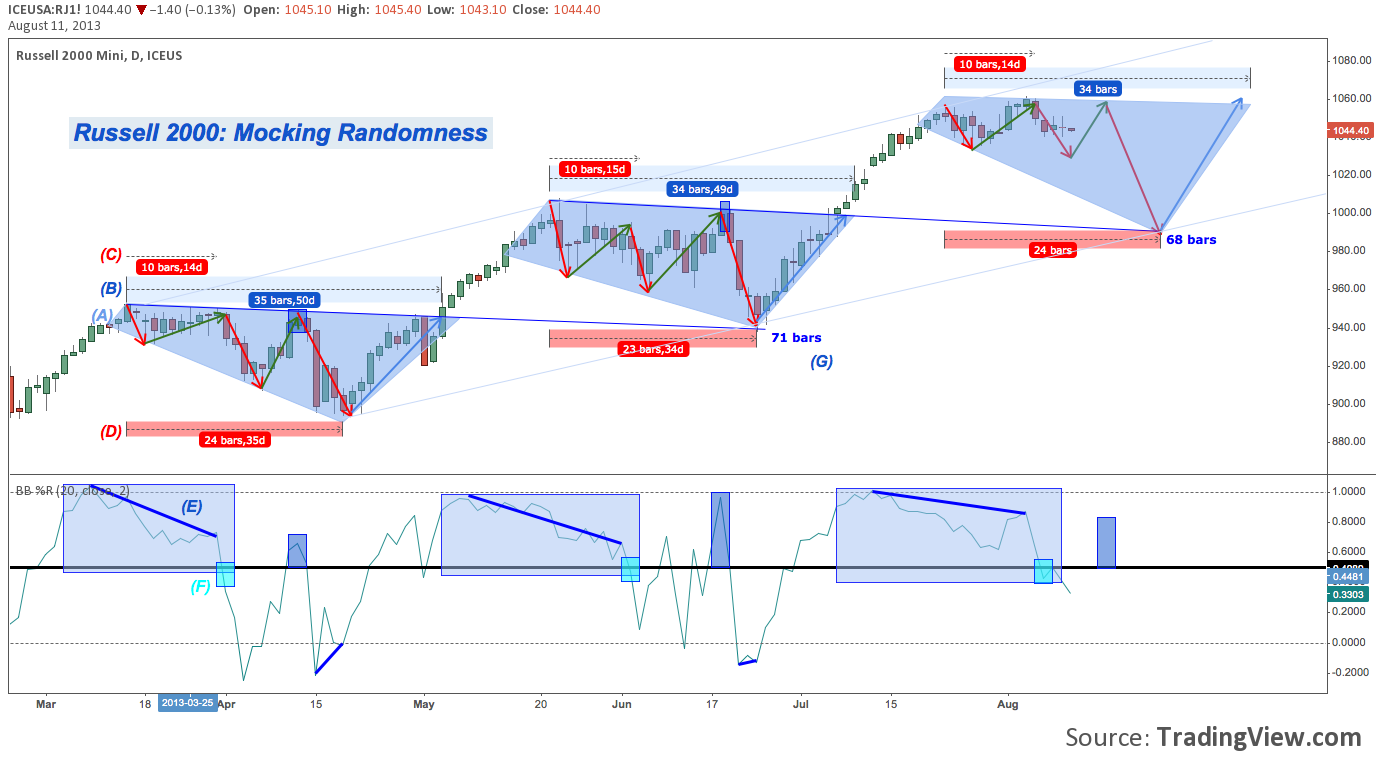
Summer inertia or not, the Russell 2000 doesn’t seem to care: file this year under “you just can’t make this stuff up”: the small cap benchmark index continues to insist on behaving with striking, startling, almost gobsmacking consistency, making a mockery of suppositions of market randomness. Here’s a semi-forensic breakdown (following the lettered features down the left side of the chart below) :
- A: The Russell 2000 has produced two Right Angle Descending Broadening Formations (RADBF) in 2013, through early July. Since late July, a third RADBF may be in the works.
- B: From initial top (and new all-time high) to pattern breakout, the patterns measured 35 and 34 trading days.
- C: Each RADBF has exhibited a uniformity of construction. The first phase is one of congestion, 10 candles in duration before a meaningful decline.
- D: RADBF’s 1 and 2 have a near identical duration from the pattern’s initial top to its lowest low (i.e. the bottom of the pattern and the pullback it characterizes): 24 and 23 trading days.
- E: Bollinger Bands %B produces a marked negative momentum/volatility divergence over the steep up-trend just preceding the pattern; and the 10 candle segment of the pattern described in C, above.
- F: This %B divergence breaks below the mid-line at 50, setting off or confirming the first intra-RADBF decline
- G: The trend line resistance that acts as the pattern ceiling of one RADBF serves as support for the next: in the case of patterns 1 and 2, this measures the time from 1’s initial pattern top to 2’s lowest low: 71 trading days.
Modeling the sequence of the previous Russell 2000 RADBF onto the pattern now possibly underway yields the following progression:
- An intermediate bottom and then a top around August 15-16 close to 1060 (denoted by the brief %B push back above) before diving lower.
- The RADBF bottoms near Labor Day around 985 where it will find support at RADBF 2’s trend line resistance 68 trading days from 2’s initial top.
- Finally, resumption of the primary trend (preceded in each previous case by a small but apparent positive %B divergence in deeply oversold territory) with almost no interruption to challenge 1060 by September 10.
Keep in mind: these projections are simple extrapolation of the nearly carbon-copied RADBFs that appeared in H1 2013 onto the immediate future – not forecasts.
Back-of-the Napkin R2k Notes
Four weeks ago, the last major 2k update discussed a few charts laying out 1040-1060 as an important short-term resistance level. There, I explained:
After +10.5% in 16 trading days and +37% off the November 2012 lows, plowing forward full-steam toward the rocky shoals of structured multi-year resistance is enough to turn on the yellow light. While there’s no reason yet to presume the index will slip into a pullback or correction, this is yet another point at which heightened caution is warranted.
The Russell met the resistance range depicted in the charts posted there and has lulled lazily inside it ever since. Given the environment, the charts posted there remain valid and current. The “yellow light” remains on for multiple reasons. Among them:
- R2k nominally broke out to 1062 last Monday (08/05) but failed and has since pulled back -1.5%. Negligible moves, the attainment and then failure to retain new all-time highs is indicative of the up-trend’s present fragility.
- The primary cyclical trend, however, remains up. Though equities seem to be circling, in fact an auspicious wind remains at the back of 2013’s rising channel until proven otherwise.
- R2k may be “correcting by time” rather than price, which is to say that the pullback has been so small that the sideways chop is simply resetting the table for another momentum break. This isn’t consistent with the previous RADBFs, however; and stopping to take breath without any attempt at price discovery would be definition of froth, leading into…
- Secular Right Angle Ascending Broadening Formation (RAABF) resistance comes in around 1060. R2k is approaching this threshold at a near parabolic angle of ascent. In this context, without a demonstration of compelling momentum, the medium-term long argument here is tenuous, at best. And given the vertical, blowoff behavior “compelling momentum” would elicit, the short-term argument seems likewise tenuous.
More to come as developments occur worth covering (other than selling volatility), probably as August 16 rolls around. Or Labor Day. Or September 10. Or September 18. Or September 22.
Twitter: @andrewunknown and @seeitmarket
Author net short Russell 2000 at the time of publication.
Any opinions expressed herein are solely those of the author, and do not in any way represent the views or opinions of any other person or entity.


")
