 By Andrew Kassen Yesterday afternoon I posted a quick hit examining the 3-month consolidation on Russell 2000 that is – just maybe – a topping pattern preceding the first legitimate market correction we’ve seen since November 2012.
Toward the end of that piece we reviewed a descending triangle on the Russell 2000 index futures contract (symbol: TF; not apparent on its ETF counterpart, IWM); there I mentioned “this week’s descending triangle will finishing winding out late today (the R2k futures product trades 24/5 except between 6 p.m. – 8 p.m. ET) or tomorrow at latest.”
Late last evening, TF broke above triangle trend line resistance at 902.5:
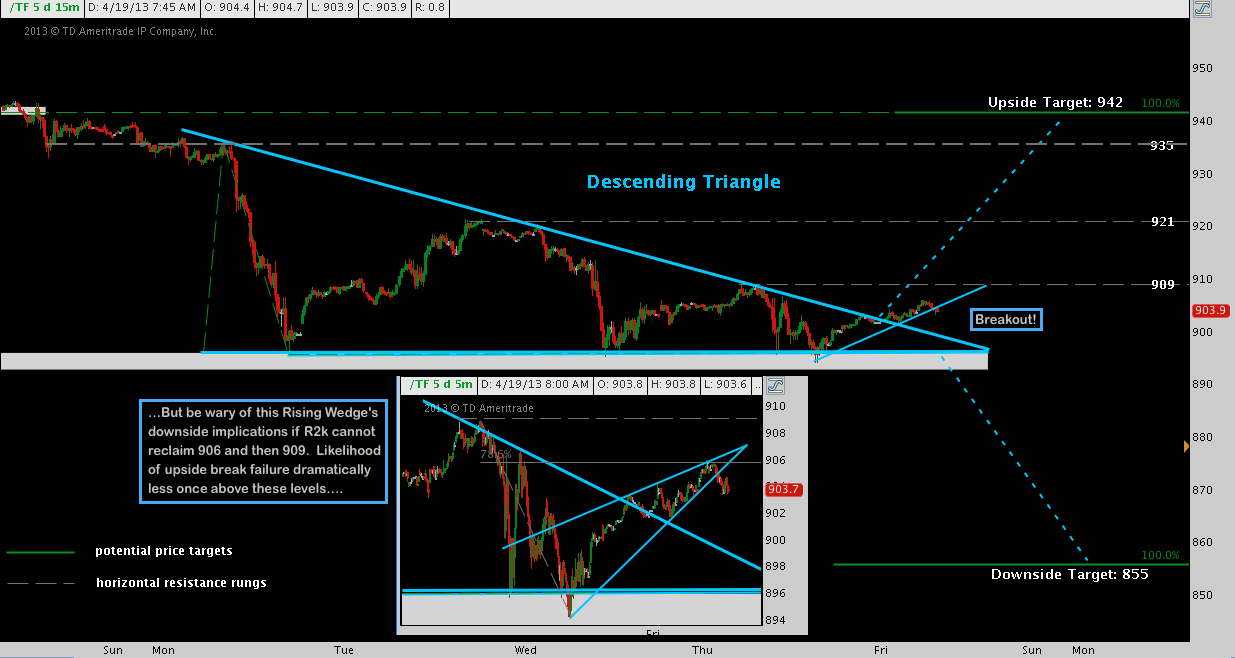
The good news: anyone interested in participating in the break during today’s regular market hours hasn’t missed much: pushing over resistance at 902.5, 10 hours later the contract is at 904.3.
The possibly-not-so-good-news (there’s always some of this, isn’t there?): The descending triangle break has formed a rising wedge since breaking last night (see 5-minute inset above). A word of caution, then, as this larger pattern breakout tries to move out of the gate: the likelihood of a breakout failure increases here because of the presence of a corrective pattern.
This is, by far, the most challenging aspect of trading classic chart patterns – right up there with letting working trades run to pattern targets. The capacity for chart patterns to whipsaw around their breakout price is the source of many a triggered stop for short-term traders and longer-term position traders alike – not to mention the frustration and disillusionment that can result when patterns “in the wild” seem to insist on contradicting their textbook descriptions.
Back to the pattern: A true failure doesn’t occur until R2k retraces below its breakout price (902.5) and back into the descending triangle. So as it stands, the upside move should be given the benefit of the doubt. At the same time: as long as TF remains below its 78.6% retracement at 906 and the swing high set early Thursday at 909, caution is warranted.
For that reason, I’ve left the downside target of the triangle on the chart – just in case.
Twitter: @andrewunknown and @seeitmarket
Author holds long position in Russell 2000 index futures control (symbol: TF) at the time of publication.
Any opinions expressed herein are solely those of the author, and do not in any way represent the views or opinions of any other person or entity.
: Worrisome to Broader Market?")

: Important Breakout Retest")

