 By Andrew Kassen Among the major broad US stock indices, the small cap benchmark Russell 2000 has led the way through much of the volatility we’ve seen in the past week. As the sole equity index futures contract I trade (and sole equity exposure I ever carry), I tend to keep a closer eye on it than any other single market measure (even the S&P 500), favoring it for its comparative technical purity and relative strength/weakness leadership from among its peers.
As the most eventful week of 2013 (or so it seems) continues to unfold, the R2k appears to be in the latter stages of developing the most involved topping pattern since Feb-April of last year (seasonality, anyone?). If US stocks are on the brink of more protracted correction, the R2k (along with the Dow Transports) is likely to lead the way. On that note then, let’s have a brief look over this pattern, viewing it at different angles to asset the shape it may ultimately take.
The first angle is a Right-Angle Ascending Broadening Formation (click image to zoom):
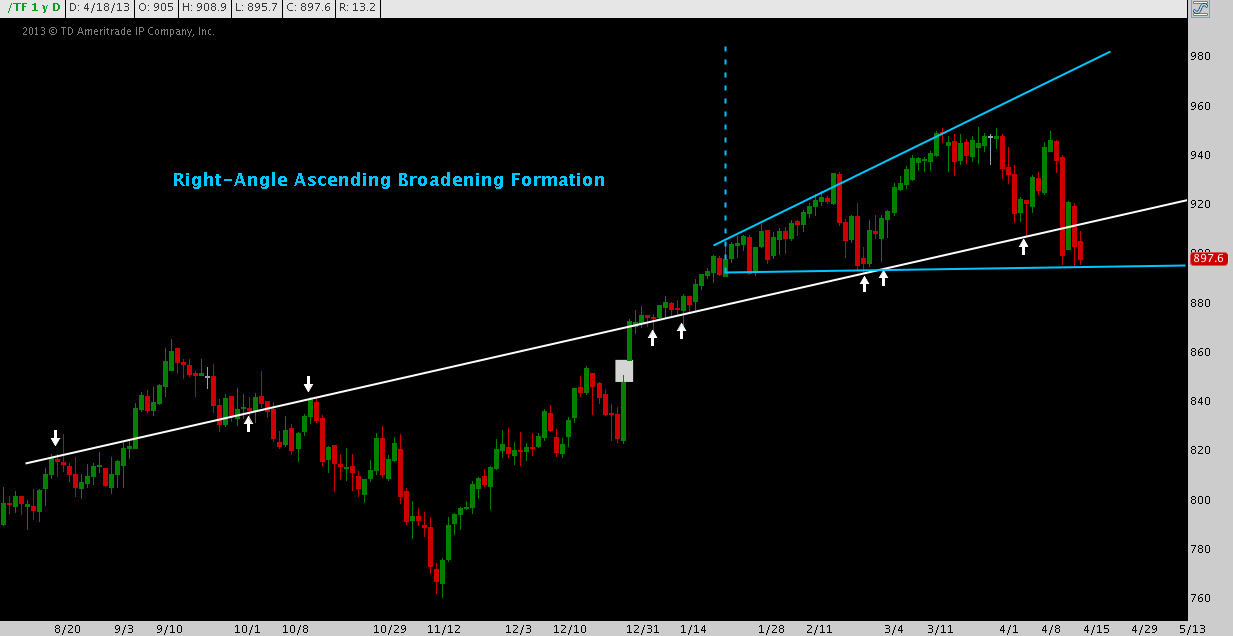
This pattern is a little tortured – more of that in a moment – lacking the uniformity we prefer to see, but is probably the best expression of the pattern through which the Russell 2000 has been winding over the last 3 months. Just above 895 support, you’ll note R2k is currently below the regression trend line (white) around which it has turned since late-Summer last year.
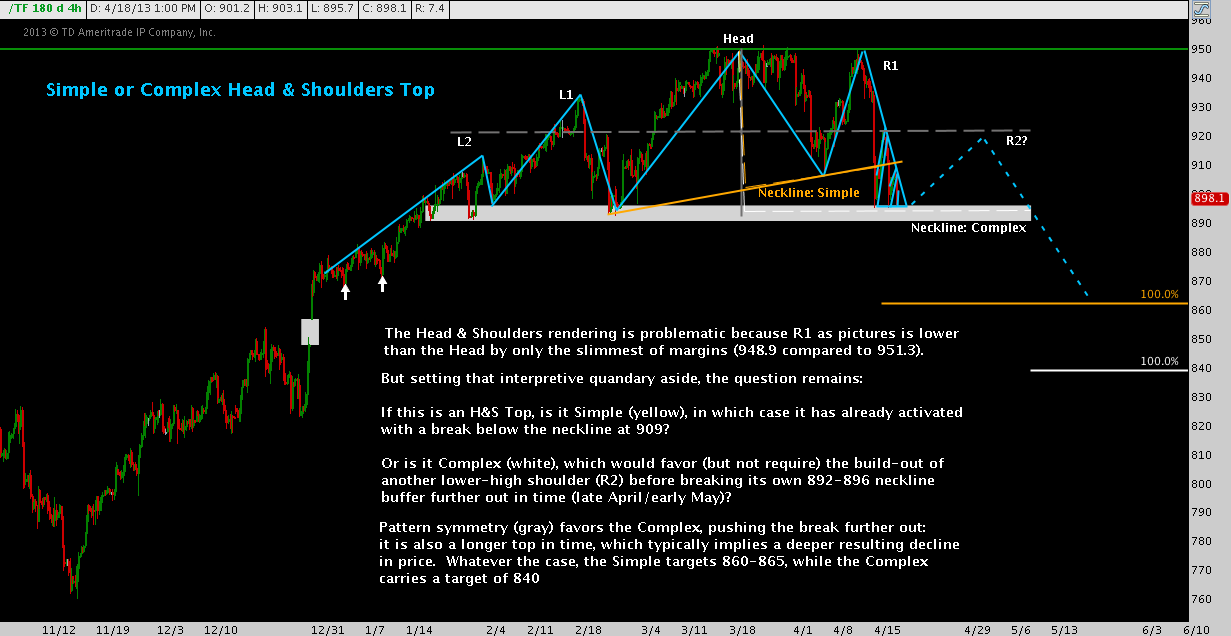
The “competing” interpretation of Russell 2000’s wide pattern consolidation is the Head & Shoulders Top. Technical niceties suggest this isn’t legitimate, but the index’s behavior may ultimately be sympathetic to it. But is the H&S pattern Simple or Complex? The answer has important implications for short-term timing (click image to zoom):
Whichever scenario unfolds, a similar bearish outcome results. Of less academic and more urgent significance is a third, more granular technical feature on Russell 2000. This week’s descending triangle will finishing winding out late today (the R2k future product, symbol TF trades around the clock 24/5 except between 6 p.m. – 8 p.m. ET) or tomorrow at latest (click image to zoom):
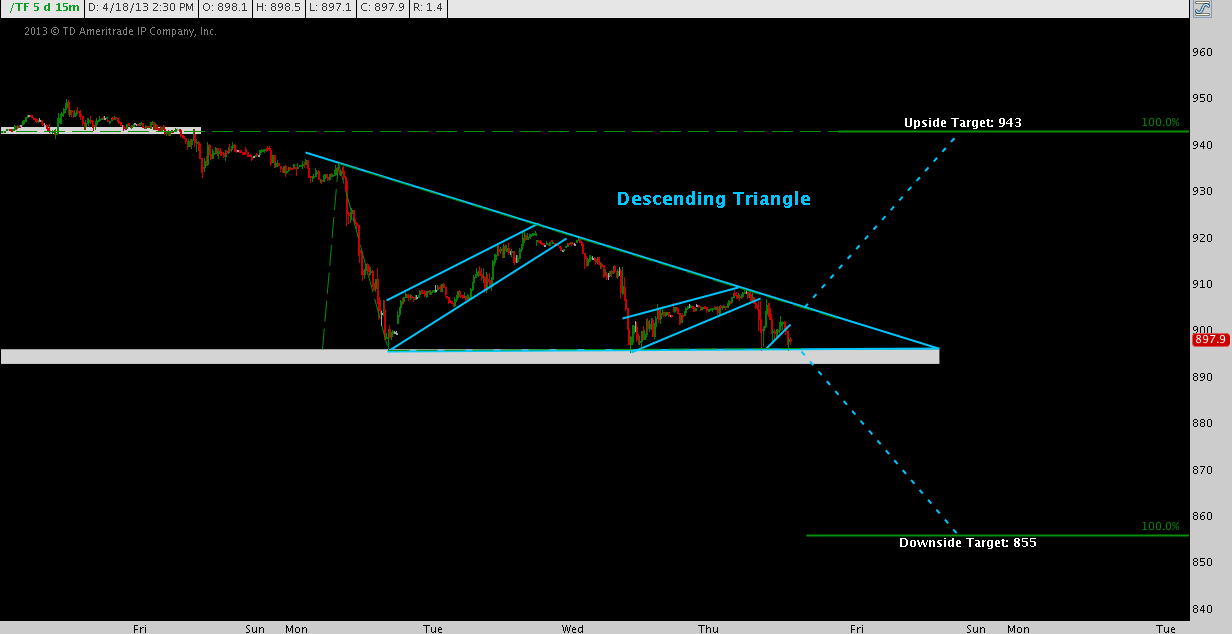
As you can see, if this pattern plays out to one of its textbook targets, it will result in a ~4% move up (returning nearly to R2k’s all-time high) or down (resulting in a legitimate 10%+ correction from R2k’s year-to-date high) at minimum.
Twitter: @andrewunknown and @seeitmarket
Author holds no position in the securities mentioned at the time of publication.
Any opinions expressed herein are solely those of the author, and do not in any way represent the views or opinions of any other person or entity.
: Creating Bullish Divergence?")

 and Semiconductors (SMH): Concerning Price Pattern?")
 and Semiconductors (SMH): Concerning Price Pattern?")


