It’s been a dreadful past couple of years for the Russell 2000 and small cap stocks.
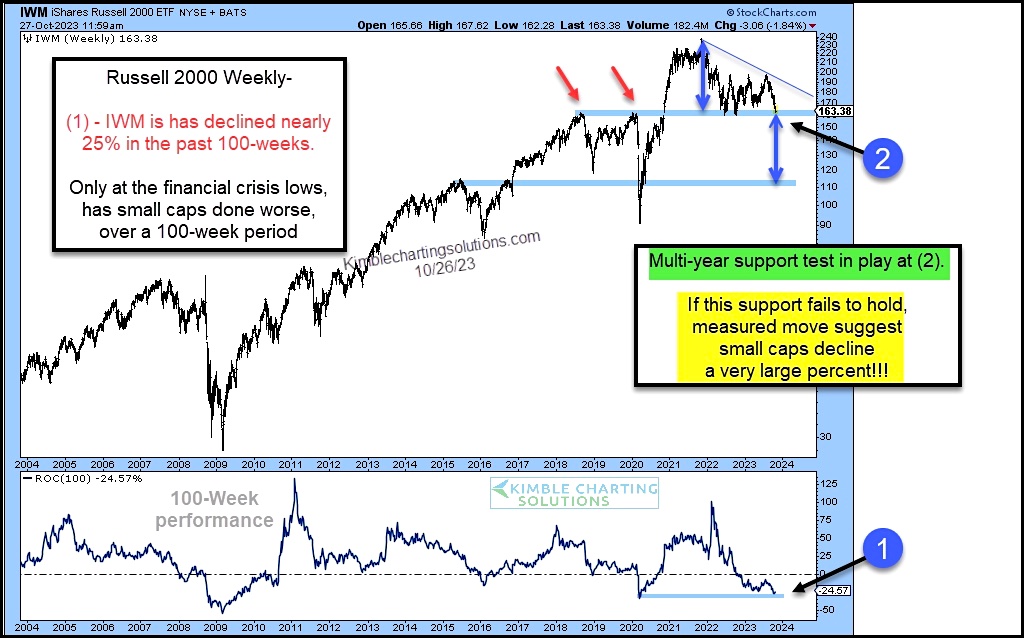
Only in 2009, have small caps performed worse over a 100 week period – point (1) on today’s chart.
Below we look at a long-term “weekly” chart to highlight some important technical developments that active investors should keep an eye on right here, right now.
After a rare 25% decline, the small cap Russell 2000 ETF (IWM) is testing support at (2). We can see that this area was prior resistance (red arrows) so it holds even more significance.
Should this support fail to hold, the measured move suggests much more downside is possible. Yikes!
Seems to me that this is an important moment in time for small cap stocks (and perhaps the broader stock market). Stay tuned!
$IWM Russell 2000 ETF “weekly” Chart
Note that KimbleCharting is offering a 2 week Free trial to See It Market readers. Just send me an email to services@kimblechartingsolutions.com for details to get set up.
Twitter: @KimbleCharting
Any opinions expressed herein are solely those of the author, and do not in any way represent the views or opinions of any other person or entity.


