Over the weekend, we looked at the weekly charts of the Economic Modern Family of ETFs.
We asked, “How is the market like a rainbow?”
We answered with, “This recent rally is built upon optical illusions.”
We are now in the autumn season with Halloween and the Day of the Dead just around the corner.
Perhaps that is why most of the economic Modern Family put on their rainbow colors and rallied.
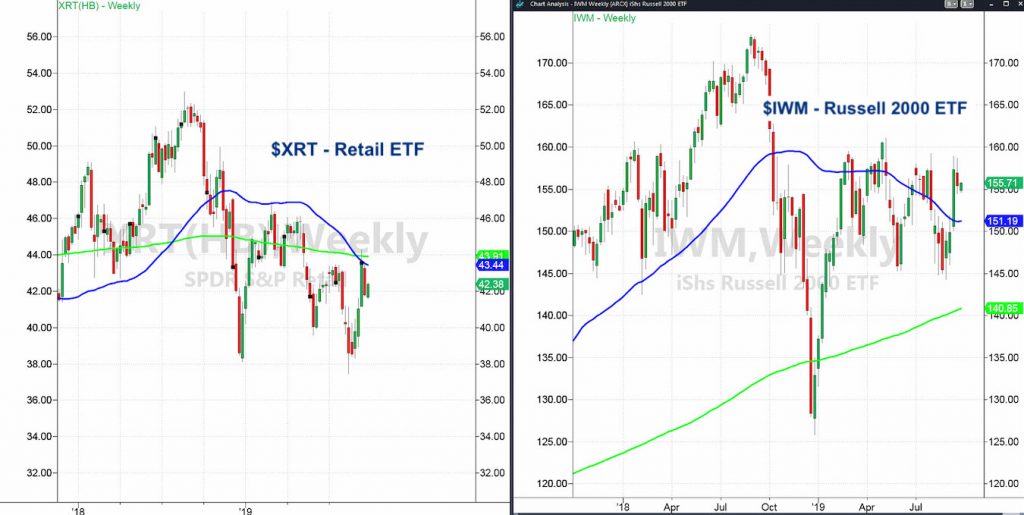
The most enthusiastic of the Family was brick and mortar Retail… or what we call Granny Retail – the Retail Sector ETF (XRT).

We noted that XRT had had an inside week.
The weekly charts show a death cross or bearish phase.
As the weakest member of the Family, the continuing decline of the slope on the 50-WMA suggested more selling is on the way.
Yet, XRT gained by over 1.00%.
Traditionally, ahead of the Day of the Dead, a family may place a loved one’s favorite foods or treats on an altar or by a photograph.
Did Granny just resurrect or this yet another optical illusion?
XRT is trading within the range of 2 weeks ago. It is in a recuperation phase on the daily charts, but in a bearish phase on the weekly charts.
Which timeframe is correct?
That’s where the inside week comes into play. Two weeks ago the high price was 44.29. The low price was 41.14.
What you want to see is which way that range breaks. Or not.
Further choppiness within that range is a good reason to stand aside.
The Russell 2000 IWM had had an inside week. The slope of the 50-WMA is negative which still suggests the current bull phase is a weak one.
However, we suggested that you watch the way the range breaks in the coming week.
Today, we begin the week still inside the trading range from 2 weeks ago. Furthermore, we are still inside last week’s range.
Additionally, the slope of the 50-WMA is neutralizing. That’s a better sign.
I’d continue to watch both XRT and IWM, but do not forget about the other members as well.
At the end of last week we thought, “Bring out yer dad.”
But instead, we begin this week with “I’m not dead yet.”
As you know, I am highly focused on commodities. In the link I spend 26 minutes explaining how and why you might consider focusing on them as well. https://youtu.be/o4_Ls-2mKdA
S&P 500 (SPY) 300 now the closest resistance. 295 is the 50-DMA.
Russell 2000 (IWM) 155 must hold (closing basis) or we will see a move closer to 152.25 or its 50-DMA. And over 159 everything changes.
Dow (DIA) We want to see this hold 266.50
Nasdaq (QQQ) 192 immediate resistance and could easily see 189.44 the 50-DMA or worse, down to 187.37 next.
KRE (Regional Banks) 52.23 is key support.
SMH (Semiconductors) Inside day. 120 immediate resistance. Under 118.31 or the gap low from September 5th, if fails, could see 116.00 or the 50-DMA.
IYT (Transportation) 190 is now the resistance with 186.50 or the 50-DMA support.
IBB (Biotechnology) 104.39 is the 50 DMA to hold if this is any good. And must clear 106.35 or the 50 DMA.
XRT (Retail) Under 41.14 not good.
Twitter: @marketminute
The author may have a position in the mentioned securities at the time of publication. Any opinions expressed herein are solely those of the author, and do not in any way represent the views or opinions of any other person or entity.


