The recent bout of volatility that gripped equity and bond markets also pushed currencies around.
During the dire days of March, the U.S. dollar and other safe- haven currencies rocketed higher, especially relative to currencies sensitive to global trade or energy, such as the Loonie.
While the market environment has calmed to a degree, there is now a tug-of-war over the direction of the U.S. dollar (USD). On the dollar appreciation side, the global economy is in a technical recession and the outlook remains very uncertain.
This uncertainty relates to how long the recession will last, the pace of the recovery and, of course, the unknown path of the COVID-19 health crisis.
High-risk aversion or any flare ups on the liquidity side, will keep upward pressure on the USD.
However, there are forces that are putting downward pressure on the U.S. dollar. Almost every central bank and government is piling on stimulus, quantitative easing, direct bond buying, liquidity mechanisms, etc. These all contribute to downward pressure on a currency whether due to the increased money supply or increased debt.
And while most governments are embarking on this behavior, the U.S. has arguably fired the biggest “bazooka”. This will likely prove to be negative for the U.S. dollar on the other side of the recession/ elevated risk-aversion period.
The Canadian dollar (CAD) versus USD does complicate things. The CAD has a number of strikes against it. With the price of oil below $20/barrel, this certainly has put a lot of downward pressure on the CAD. Canada’s economy is also more sensitive to global trade, not the best during a recession. And our economy has a big reliance on real estate, which is under pressure given social distancing measures and inherent leverage.
We could see another dip in the CAD or spike in the USD on another bout of risk aversion, but investors should remember the market is aware of all of the above. True, if the real estate bubble finally bursts, the CAD will move lower. But it’s likely that in six months after distancing has been largely reduced, oil will be higher, real estate more stable and potentially the recession may be shifting towards a recovery. That will be good for the CAD and bad for the USD. But there is no rush.
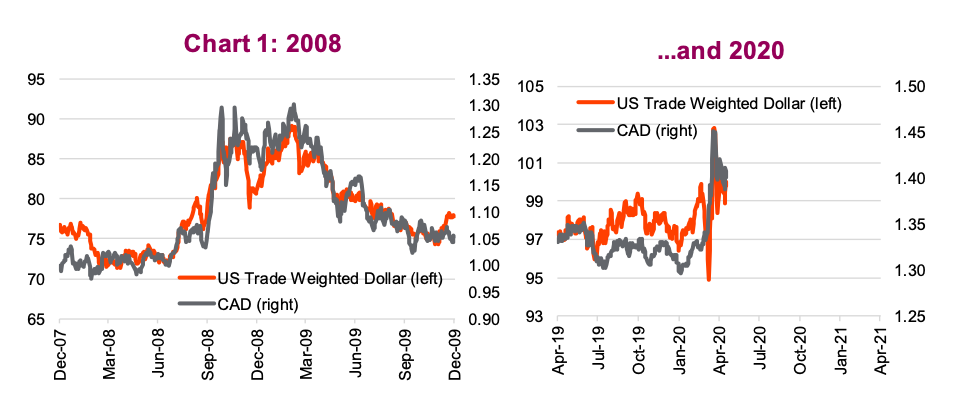
While we are not overtly bearish on the USD versus the CAD at current levels (1.40 or 71.5 depending on how you like to look at it), we are certainly leaning towards being a USD bear over bull. The USD is great during a crisis but not great coming out of one (chart 1). And the CAD does have valuation on its side (chart 2).
One other way to defend against a falling USD is through exposure to gold.
Gold continues to shine
Over the past few years, we’ve been big proponents in the diversification benefits of holding a decent gold exposure in portfolios. At the time, with markets making consistent new highs and the bull aging, it only made sense in our opinion to have some defense.
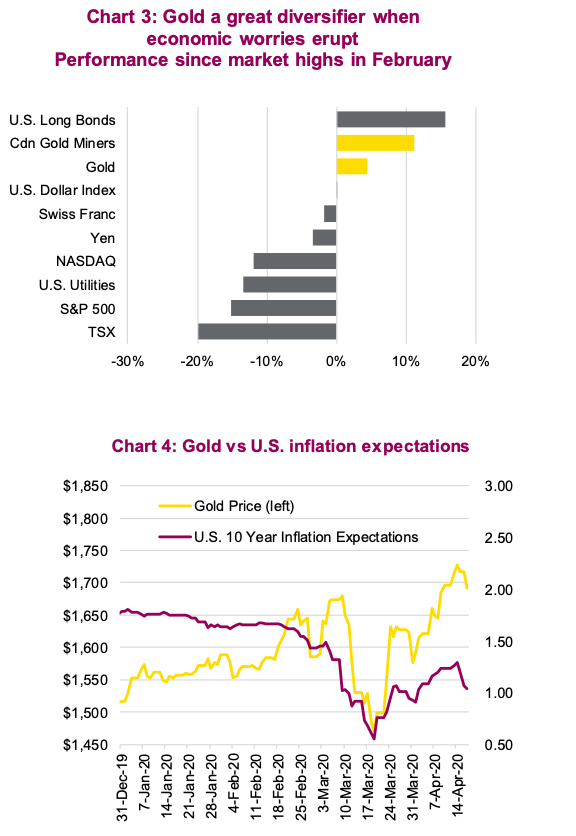
While we had little foresight in what this new decade would bring – certainly not the current crisis – there is some comfort knowing that gold has largely behaved as we would have expected. Besides U.S. long bonds, bullion and even miners have added some precious resilience to portfolios.
Rallies in relatively safe assets alongside the rebound in equity markets suggests many are unconvinced by the recent gains that the worst is over. While equity markets have clawed back half of the losses since the low set on March 23, gold has risen to its highest level in more than seven years. There remains quite an appetite for the safety that gold provides.
It wasn’t necessarily a smooth ride; it had a brief but severe period of weakness in March, which saw gold prices fall by over $200 an ounce. It was a victim when investors went into “sell everything” mode. If you recall, this occurred during a period when Treasury yields shot up from all-time lows of 0.37% to a high of 1.27% on March 19.
Margin calls were a driving factor, but not the only one. Inflation expectations were also falling quickly but we’ve since seen a reversal in inflation expectations. Breakeven rates have risen from a low of 0.47% on March 19 to a high of 1.30% on April 14. They’ve since dipped again in the past couple of days. Chart 4 (above) overlays 10-year breakeven rates, which serve as a proxy for inflation expectations with the price of gold. While the fear of deflation was driving gold lower, this was largely fixed with governments aggressively easing fiscal and monetary policy.
Risks
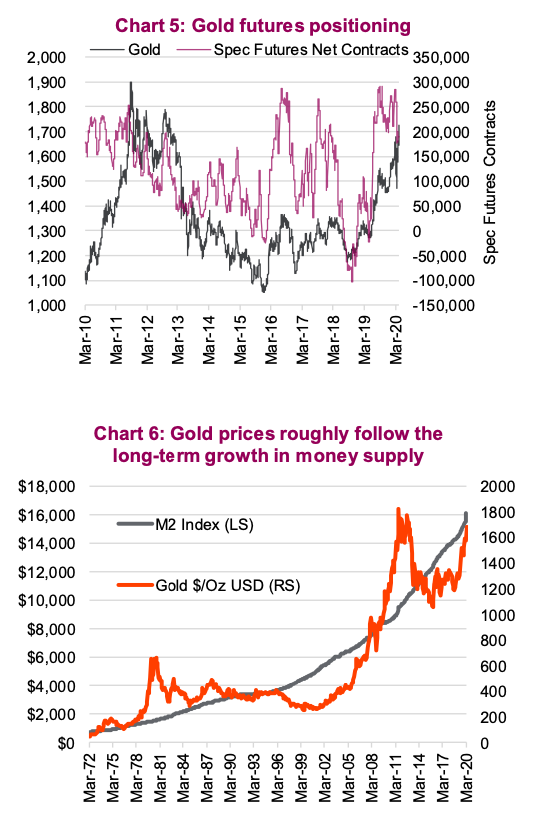
One big risk is that this trade isn’t in the early innings. Large speculators’ short positions in gold are at multi-year lows, driving net positioning to be overly bullish. The gold price just made fresh seven-year highs. There’s the potential for profit taking and a slight reversal, which we believe should be used to add exposure.
Fed intervention
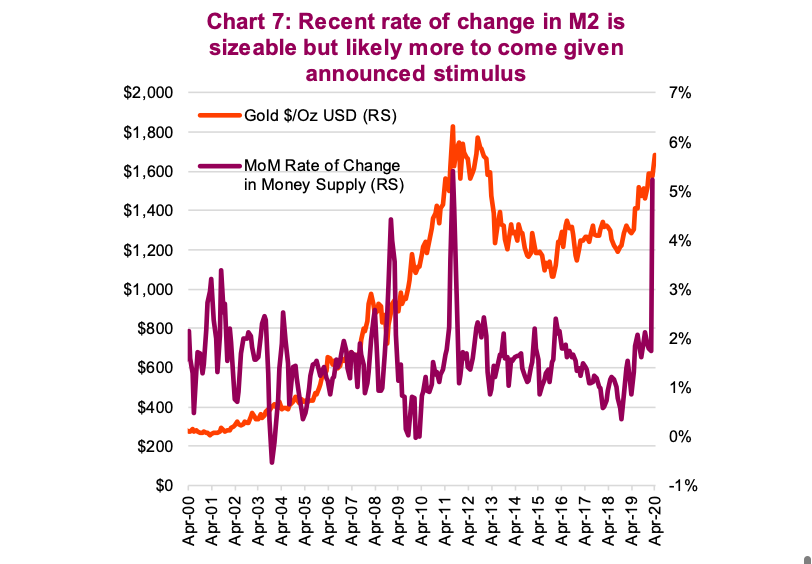
While gold priced around $1700 is well off the lows from a few years ago, it’s not that expensive in relation to the amount of money supply. Chart 6 (above) shows gold prices loosely follow the long-term growth of the money supply, and with the amount of money the U.S. Federal Reserve has already printed, and the amount it’s about to print, gold even at today’s price does not appear to be overly inflated. The rate of change in the money supply over the past four weeks is substantial. In an era of helicopter money, the likes of which we’ve not seen since WWII, we expect assets that can retain their value during reflationary periods look attractive.
The response by central banks like the Fed have the potential to devalue their currencies. Simply put, central banks have just created a lot more cash, and alternative assets – particularly those that retain their values during reflationary periods – will be attractive during the ensuing rebound.
Real assets
Real rates have always been a primary driver for gold prices. Our expectation over the medium to long term is for asset-price inflation to take hold. This has positive ramifications not only for gold but for real assets in general. When we say “real assets”, we mean physical/hard assets such as commodities, real estate and physical infrastructure. If we’ve learnt anything over the past decade it is that quantitative easing might not cause price inflation, but it certainly drives asset prices higher.
With much of the world in lockdown, creating a self-induced recession, this will have a negative near- term impact on real asset prices. Hotels, malls, offices and even houses will feel the effects and debt often used in these industries will only compound the impact.
This lockdown and potential global recession will be deflationary in the short term. This is negative for many real assets, so the time is not now. However, looking past this unique period, with all the money printing and stimulus and currency devaluations, the time for broader real assets is coming – stay tuned!
Source: All charts are sourced to Bloomberg L.P. and Richardson GMP unless otherwise stated.
Twitter: @ConnectedWealth
Any opinions expressed herein are solely those of the authors, and do not in any way represent the views or opinions of any other person or entity.


