Chasing the Dragon
“There is no other agency of government which can overrule actions that we take.” – Alan Greenspan
The Federal Reserve (Fed) currently expects real economic growth for the foreseeable future to average below 2.00%. Japan, the United Kingdom, and the European region are forecasting an even more anemic pace. On numerous occasions, we have detailed the reasons the United States and many foreign nations are mired in economic stagnation.
At the top of our list, is the overreliance on debt and the burden that decades of debt-driven-consumption policies have inflicted upon economic activity. To not only accommodate existing debt, but promote more debt, Keynesian schooled central bankers have presided over extremely easy monetary policy for years. Policy has been administered through a combination of low-interest rates and more recently, as desperation escalates to keep the economic engine from sputtering, money printing.
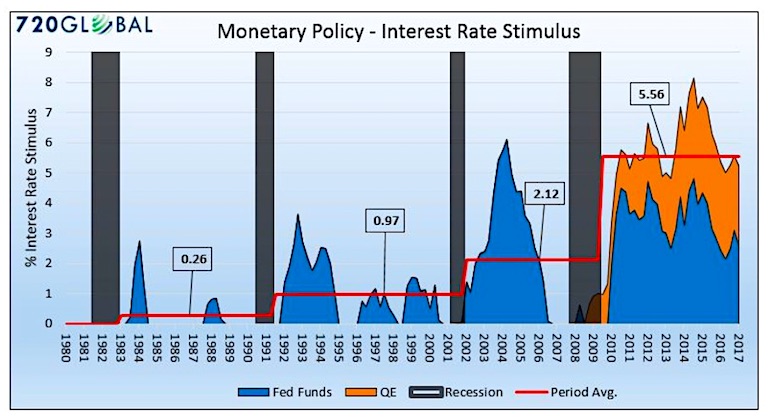
In “How Much is too Much” we shared the following graph that plots the exponentially increasing amounts of stimulus supplied by the Fed to combat recessions and “sub-par” economic growth.
The graph above, and many others comparing the actions taken by central banks over the last 30-40 years provides sufficient scale to understand the use of the word “extraordinary” to describe policy resulting from the Great Financial Crisis of 2008.
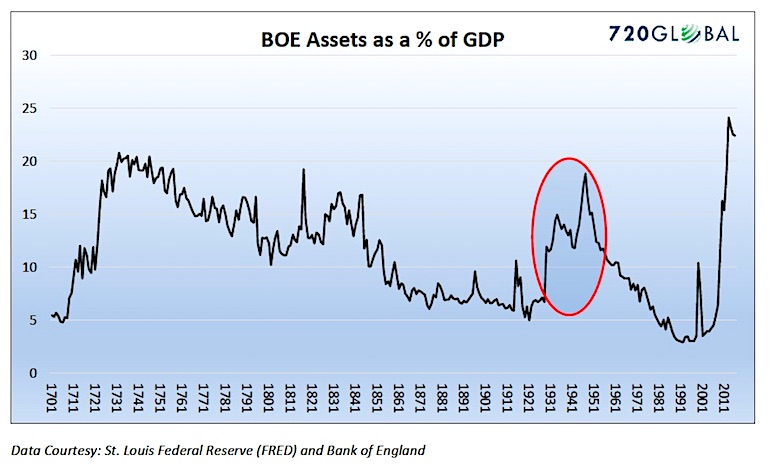
We thought it was worthwhile to extend the study to help you fully grasp the sheer lunacy of what has taken place over the last nine years. The fascinating chart below plots the size of the Bank of England’s (BOE) balance sheet as a percentage of GDP since the year 1700.
The size of the BOE’s balance sheet is nearly equivalent to the amount of stimulus supplied by the Bank of England. Note the red circle highlighting the sharp increase from 1929 to 1947. This period covered three devastating events for the United Kingdom. In 1929, the Great Depression began and strangled growth worldwide. At the time, the British Pound was the reserve currency, so the stifling of global trade imposed inordinate demands on the British Pound. Approximately ten years later they were heavily involved in WWII. The UK declared war on Nazi Germany in 1939 and experienced extensive destruction to their cities and infrastructure. In 1944, as the war was nearing an end, the Bretton Woods agreement was signed which marked the beginning of the end for the pound as the world’s reserve currency.
During this tumultuous 18-year period, the BOE’s balance sheet increased 180%, marking a significant change in the trend of the prior 250 years. Now consider that, over the last eight years, the amount of stimulus supplied by the BOE has increased 251%. Given the contrast, this graph effectively conveys the seriousness of the current economic situation in the UK and is symptomatic of all developed economies.
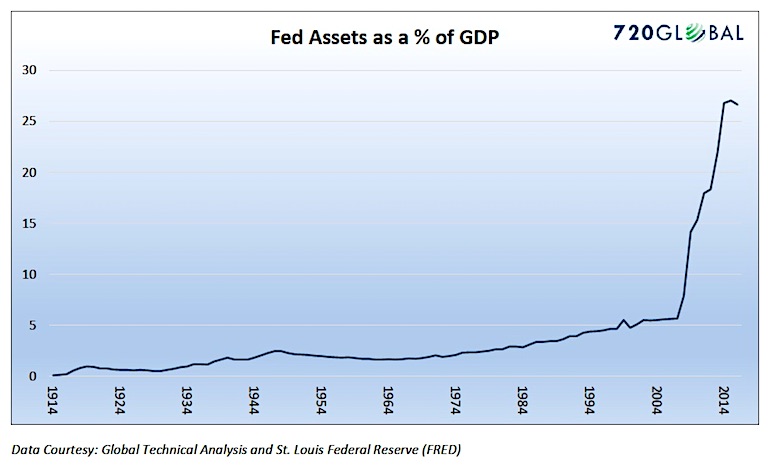
Given that the U.S. Federal Reserve was established in 1913, we do not have historical data comparable to what is shown in the BOE graph. That said, using various sources and the generous help of others (special thank you to Brett Freeze – Global Technical Analysis), we came up with the following chart going back to the Fed’s inception.
Data Courtesy: Global Technical Analysis and St. Louis Federal Reserve (FRED)
Like the BOE graph above, the contrast of recent growth of the Fed’s balance sheet (+428%) is nothing short of alarming. The fact that this posture has been sustained now for nearly a decade and is producing the weakest recovery on record is even more disconcerting.
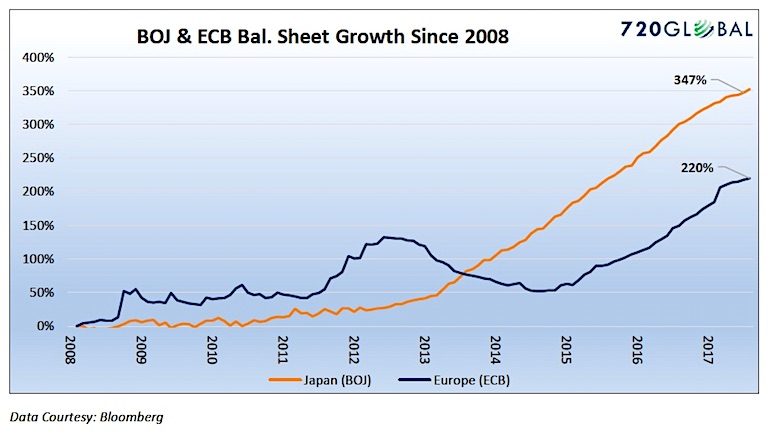
The graph below shows the tremendous growth of Japan’s and Europe’s central bank balance sheets since the crisis.
Summary
There is clearly something wrong when a central bank prints money in rapidly growing amounts. Such a departure from prior trends enables other undesirable events to transpire. The Fed, Wall Street, and the media serve up complicated economic explanations for why this time is not different from the past. The evidence provided in these charts argue something is very different.
Our experiences during the Great Financial Crisis provided first-hand evidence of the instabilities caused by too much debt. The years since have been the denial of that evidence as the debt burden has only grown larger. There is little doubt that the years to come will eventually bear witness to the resolution.
The charts above illustrate that central bankers have been desperately trying to use liquidity to offset the prior excesses. However, this is not a liquidity problem it is an insolvency problem. Egregious improper use of their balance sheets has only made the prospects for resolution worse as zombie banks, companies, and consumer debt that should have been liquidated are imprudently allowed to survive. It is just an eventuality that the Minsky moment will arrive – the time when extensive amounts of debt must be written off, losses taken and financial institutions re-capitalized. When that day arrives, the central bankers and their sledge hammers of monetary policy will not have the precision required to patch the problems yet again. At that point, they can either allow the economy to naturally deleverage in what would certainly be a painful economic event or they can print even more money in further attempts to reflate the economy. Experience has shown that the second option, while it delays the inevitable, is every bit as painful as the first. Our guess is they will select option two and desperately try to kick the can as long as possible and extend the charade of the past few years.
Like a drug addict chasing the proverbial dragon, the world’s central bankers are faced with the painful choice of rehab to break the grip of easy money or an on-going downward spiral toward economic demise.
Twitter: @michaellebowitz
Any opinions expressed herein are solely those of the author, and do not in any way represent the views or opinions of any other person or entity.


