Qualcomm (QCOM) reported earnings on Thursday after-hours.
On an adjusted basis, the company reported EPS of $0.99, which beat consensus estimates of $0.86. Revenues came in at $5.08B, which also beat consensus estimates of $4.86B.
Qualcomm noted a decrease in the number of orders from Chinese customers as a result of the coronavirus.
The company downgraded the lower range of their earnings outlook for the current quarter.
Qualcomm now expects adjusted EPS to be between $0.80 – $0.95 and forecasted revenues to be between $4.9B – $5.7B. Wall Street was forecasting EPS of $0.86 on revenue of $5.1B.
Given this background, let’s see what the charts tell us.
Qualcomm (QCOM) Weekly and Daily Chart Grid
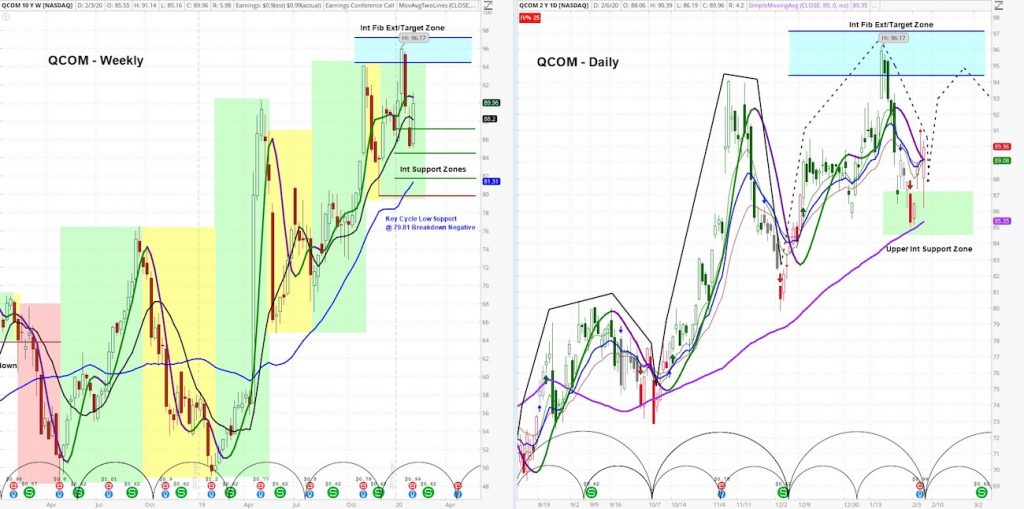
At askSlim.com we use technical analysis to evaluate price charts of stocks, futures, and ETF’s. We use a combination of cycle, trend and momentum chart studies, on multiple timeframes, to present a “sum of the evidence” directional outlook in time and price.
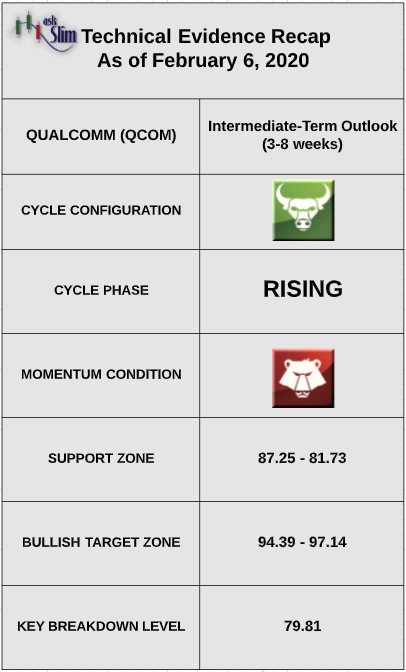
askSlim Technical Briefing: The weekly and daily cycle analysis suggest that the stock is in a positive pattern. However, QCOM has negative momentum on both the weekly and daily timeframe.
On the upside, there is an intermediate-term Fibonacci projection/target zone from 94.39 – 97.14. On the downside, there is an intermediate-term Fibonacci support zone from 87.25 – 81.73. For the bears to regain control of the intermediate-term, we would likely need to see a weekly close below 79.81.
askSlim Sum of the Evidence: Qualcomm is in a positive intermediate-term pattern with negative momentum. Given these conditions, we would expect the stock to be range bound for the next several weeks. On the upside, there is a likelihood that the stock will retest the Fibonacci projection zone beginning at 94.39 by the end of February to early March.
Interested in askSlim?
Get professional grade technical analysis, trader education and trade planning tools at askSlim.com. Write to matt@askslim.com and mention See It Market in your email for special askSlim membership trial offers!
Twitter: @askslim
Any opinions expressed herein are solely those of the author, and do not in any way represent the views or opinions of any other person or entity.


 Rolling Over At Key Fibonacci Level?")

 Ready To Break Out?")