The lifeblood of the equity market is the earnings generated by the companies in the index. With Q3 2021 corporate earnings nearing, we discuss the current lay of the land (stock market and valuations).
Sometimes the market pays more for these earnings (like these days), sometimes less. For instance, over the past decade, the price-to-earnings (PE or market multiple) for the S&P 500 Index has ranged from 10.3 to 23.2, with the current level at 21.1. This is based on forward 12-month consensus estimates for earnings. Canada’s TSX has a similar range, 10.8 to 20.8, although its current PE ratio at 16x is not in the upper range.
How much the market will pay or value $1 of earnings changes frequently—and sometimes quickly.
The market multiple is influenced by many factors, including yields in the bond market as this is a competing asset class to equities. Historically, higher yields have coincided with a lower PE ratio for the equity market. I mean, if you are going to receive say, a guaranteed 5% coupon from bonds, you won’t pay as much for a $1 of earnings given all the added uncertainties with equities. With low yields these days, equity PE ratios tend to be higher.
However, the biggest driver of the market multiple is the outlook. If the economy is doing well, with few clouds on the horizon, the PE ratio tends to be higher. When uncertainty about the future path of the economy increases, investors won’t pay as much for earnings as the future path becomes less certain.
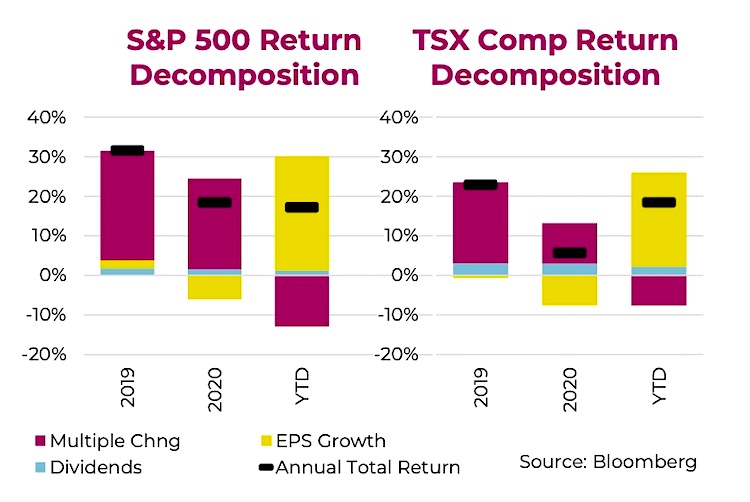
In 2019 and 2020, market returns were predominantly driven by multiple expansion. Yes, even during that quick bear market, which saw a rapid multiple compression only to be followed by an even more incredible multiple expansion. The chart above decomposes the annual returns for the S&P 500 and TSX comprised of dividends, earnings growth and change in the multiple. The red bars are changes in the market multiple—by far the biggest driver of index performance in the past two years. Please note, while earnings and dividends grow over time, the market multiple does not grow; it is a zero-sum game. In other words, multiple expansions are offset by multiple contractions in other years.
We have started to see some multiple contraction after a few years of expansion in 2021. So what’s this mean for Q3 2021 corporate earnings?
The good news is that earnings growth came to the market’s rescue, big time. The forward 12-month consensus earnings for the S&P 500 was $166 at the start of 2021; it is now $214 for the next 12 months. Initially earnings were just rebounding off depressed levels, but over the past few quarters it has been the stronger-than- anticipated economic recovery that has driven estimates even higher. Rising earnings cure or soothe many market ailments. Higher yields, Fed tapering, China real estate issue; if there is enough earnings growth the market won’t care nearly as much.
Uh oh
So why are we going on about earnings? Earnings growth, or more accurately rising earnings forward estimates have driven market returns in 2021 (big yellow bars in the previous chart). Re-opening economies, higher commodity prices and surprisingly robust demand growth focused on durables over services, created the perfect elixir for S&P & TSX earnings. A 29% rise in forward earnings from nine months ago is the fastest pace we have seen in a long time. TSX at 24% is no slouch either. But, over the past few weeks we have started to see earnings estimates begin to fall. Don’t get too alarmed, this isn’t earnings growth turning negative, estimates are just falling.
Currently, the S&P 500 is expected to earn $198.62 for 2021 (two quarters in the bag, two to go). And next year, bottom-up consensus estimates are for $218.03. Clearly positive, albeit a slower pace of earnings growth (+10%).
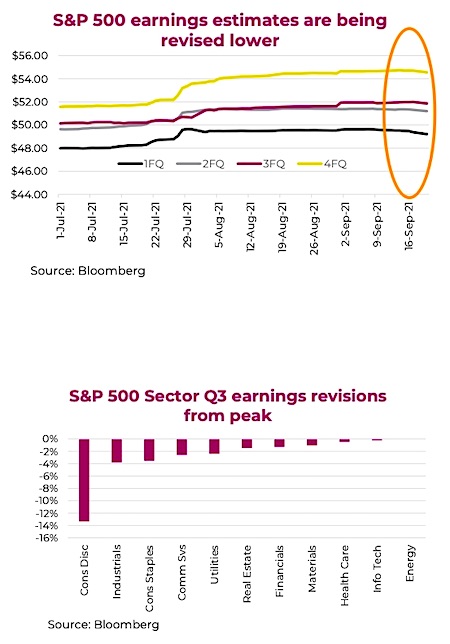
These estimates have started to decline, reversing a trend in rising estimate revisions that had been the trend. For the past year the trend in estimate forecasts has been in the upward direction. But in mid-August this trend stalled, and September has witnessed analysts revising their earnings forecasts lower (chart to right). A subtle decline, but the new direction is not encouraging.
Some slowing of momentum in economic growth is one factor, but rising costs is another. Last week saw Fedex Corp, often a bellwether for economic activity, highlight that while demand and pricing remain healthy, costs are now rising faster and offsetting the good news. Shares fell 8% on the news.
Digging deeper into Q3 2021 corporate earnings, which will start to be reported early in October, negative revisions appear most prevalent in a few sectors, with consumer Discretionary taking the brunt of the revisions. A couple of factors are contributing to this including autos, which are experiencing supply chain disruptions. Plus, as the economy re-opens and consumers begin spending more on services, a side effect of this is spending less on durables (a big component of Consumer Discretionary). Industrials have seen the 2nd largest decline in estimates and this will likely expand as analysts update their forecasts from the Fedex lowering of guidance.
There is a silver lining to these U.S. trends in sector earnings revisions for Q3. The TSX, given its heavier weighting in Energy, Materials and Financials should be less impacted, assuming the sector trends are evident across the border. In fact, this is what the numbers show as well. Estimate revisions for the TSX Q3 earnings season have not seen the same negative revision pace as the U.S. market. Go Canada.
Investment implications
Earnings growth and positive revisions have helped equity markets move higher over the past year. Unfortunately, that positive impulse appears to be fading. While the negative revisions are minor so far and there is still positive earnings growth, this coming Q3 earnings season may not be a cakewalk. The past earnings season have witnessed much higher-than-normal positive surprise rate in terms of the frequency of companies exceeding estimates and the magnitude of those ‘beats’. As costs continue to rise and the pace of top-line sales growth slows, companies better able to control costs and/or pass costs onto customers should fare better.
Since markets tend to focus on the second derivative of change, i.e. the earnings growth rate slowing, as opposed to earnings themselves turning lower, this could inject more negative volatility into prices, especially on earnings days.
As we noted above, rates matter as well, and this week saw a pronounced one-day jump in yields. No doubt they are still low, but the trend of higher yields that started in Q2 2020 seems to be resuming after a five-month pause.
We would also refer you back to last week’s Ethos, where we discussed inflation and point out that in wage inflation in particular would be something to watch. Businesses that employ a lot of people and have labour as one of their biggest input costs could be more affected than most. Both because of the difficulty finding workers, but also the rising cost of paying them.
Added consideration should be given to holdings or exposure to Consumer Discretionary, Industrials and Consumer Staples. Estimates in these sectors are being revised lower for good reason. Having less exposure or tilting towards more defensive holdings in these sectors may prove prudent as we begin to navigate through more challenging earnings seasons.
Source: Charts are sourced to Bloomberg L.P., Purpose Investments Inc., and Richardson Wealth unless otherwise noted.
Twitter: @ConnectedWealth
Any opinions expressed herein are solely those of the authors, and do not in any way represent the views or opinions of any other person or entity.


