And just like that, market volatility returns…
Investing Highlights and 1Q 2018 Insights:
- Economic Fundamentals Remain Strong
- Valuations Show Prices Have Outpaced Earnings
- Market Weakness Has Helped Relieve Excessive Optimism
- Mid-Term Elections Looming
- Broad Market Lacks Momentum Tailwind
After a historically quiet 2017 and a strong start to 2018, stocks have experienced the return of more normal volatility and a pullback that saw the popular averages dip into the negative territory on a year-to-date basis. The S&P 500 has experienced its first 10% pullback since 2016 after investor optimism swelled as stocks rallied 7% over the first three weeks of the year.
Q1 2018 Investing Outlook Summary
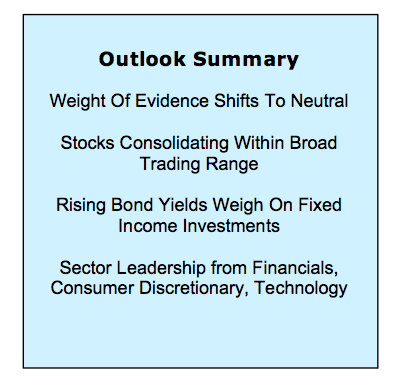
The popular averages remain well off their highs, but some degree of near-term stability has emerged. Only time will tell whether the cyclical rally that began in early 2016 is still intact – at this point the arguments for and against are inconclusive. We have, however, seen the weight of the evidence shift from bullish to neutral. This suggests, that at least for now, stocks are settling into a broad consolidation range that could give fundamentals a chance to catch up (at least somewhat) to prices.
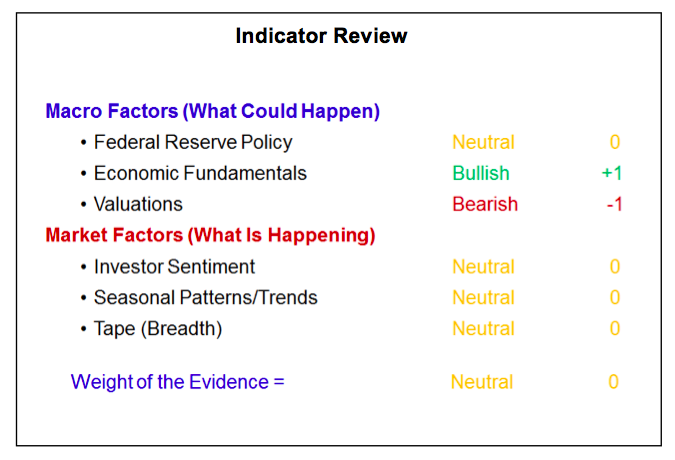
The macro factors have not changed. Valuations remain bearish and the Economic Fundamentals are still bullish. Fed Policy still sits at neutral, but the new Fed Chairman has plenty to keep an eye on. The changes in the weight of the evidence come from the market factors. Investor Sentiment has moved from bearish to neutral as optimism has waned as stocks have pulled back. Seasonal patterns and Breadth have both been downgraded from bullish to neutral. Challenges facing new leaders at the Fed and ahead of mid-term elections make the seasonal backdrop less favorable. The broad market suffers from deteriorating trends and a lack of upside momentum.
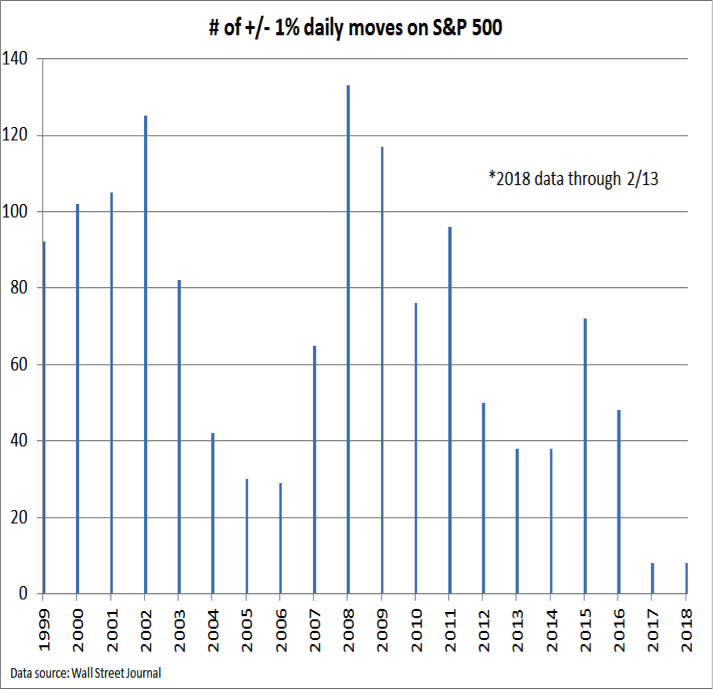
Before turning to the weight of the evidence, it is important to provide some perspective on this year versus last year. For all of 2017, the S&P 500 had eight daily moves of +/-1%. In 2018 it has taken just six weeks to see the same number of such moves. While volatility has indeed risen in 2018, it represents a move away from what was an historical anomaly in 2017. In the 18 years preceding 2017, the S&P 500 had experienced daily moves of at least 1% between 29 and 133 times per year (a median of 65 such moves). So far 2018 is holding to the pattern of those years. In other words, it seems that 2017, not 2018, is the outlier and more volatility could be in store. We discussed this in our 2018 Outlook piece (Clouds Could Test Investor Resolve) and see little at this point to dissuade us from that view.
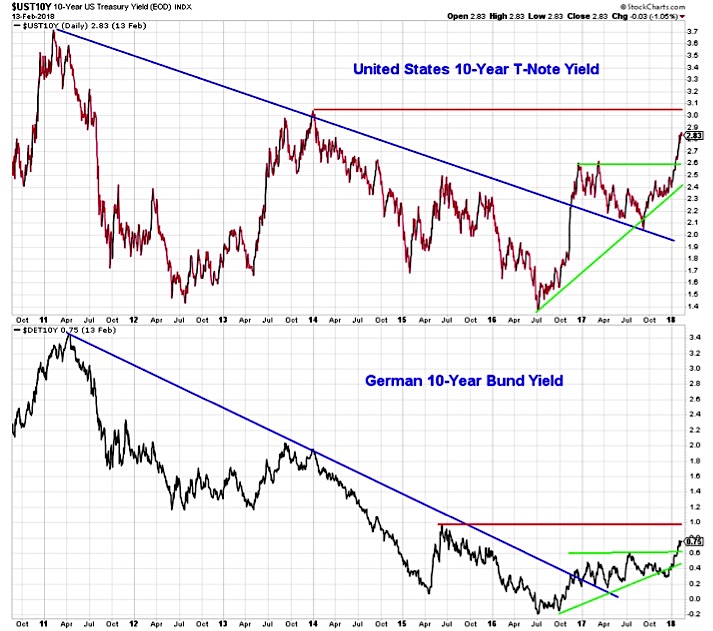
Federal Reserve Policy is still neutral. The Fed finds itself under new leadership (welcome to the helm, Chairman Powell) at a time when the market is revising higher its expectations for rate hikes (from three to four for 2018) and bond yields both at home and overseas are breaking above resistance and moving to levels not seen in several years. While there is some evidence that inflation pressures are on the rise, bonds are likely also looking at changing supply/demand dynamics: at a time when the Fed is winding down its balance sheet (reducing demand for Treasuries), expansionary fiscal policy means increased deficits (increasing supply of Treasuries) going forward.
Economic Fundamentals remain bullish. The economy, both at home and overseas consistently beat expectations over the second half of 2017, but that good news is now in the past. Continuing to provide upside surprises could be more of a challenge as expectations have since moved higher. The initial print on the Atlanta Fed’s GDPNow model for the first quarter was above 5.0% (since lowered to 3.2%) and corporate earnings estimates are seeing their largest upward revisions since FactSet began tracking that data. Even if near-term expectations have gotten ahead of themselves, economic trends remain strong. Inflation is still relatively low, as are initial jobless claims. Animal spirits are alive and well, as represented by small business optimism indicators that are at their highest levels in decades.
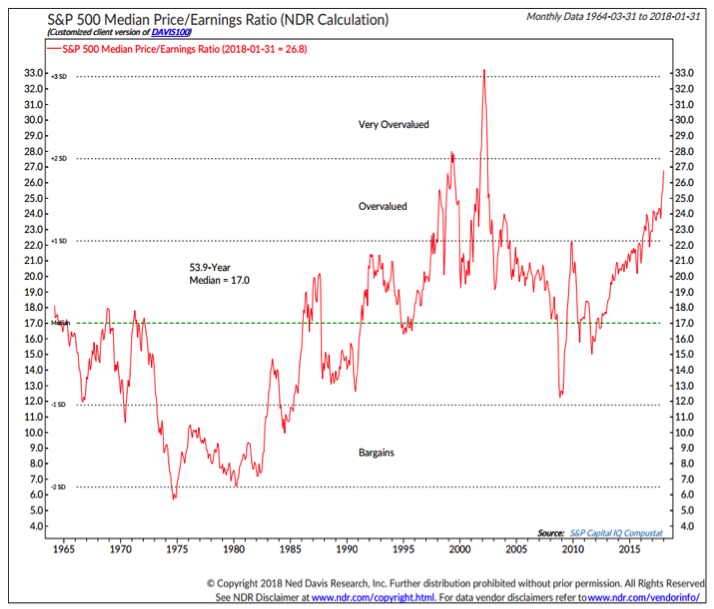
Valuations remain bearish. Upward revisions in earnings estimates are encouraging evidence of confidence in the economy, but from a valuation perspective, we prefer to look at actual earnings. On that basis, stocks remain expensive by historical standards (this monthly chart does not reflect any of the price fluctuations that have been seen in February). We will admit to some skepticism that the robust earnings expectations for 2018 can be met, but are encouraged by data for the fourth quarter that shows companies beating expectations for both earnings and revenue. If this trend continues in 2018, it could help re-set valuations. Given how long prices have moved ahead fundamentals, however, this process could take time to unfold.
Investor Sentiment has shifted from Bearish to Neutral. Sentiment is looked at from a contrarian perspective – widespread optimism (in terms of action or belief) is considered bearish and deep-seated pessimism is viewed as bullish. The rally that climaxed in January came with optimism that was nearly off the charts. One way to view that is from the lens of equity fund flows. While they have begun to moderate, the $60 billion that flowed into equity funds in January dwarfed previous inflows and, with other sentiment indicators, may have signaled some final capitulation on the part of bearish holdouts. As often the case, the point of maximum optimism typically coincides with the peak in prices.
continue reading on the next page…


