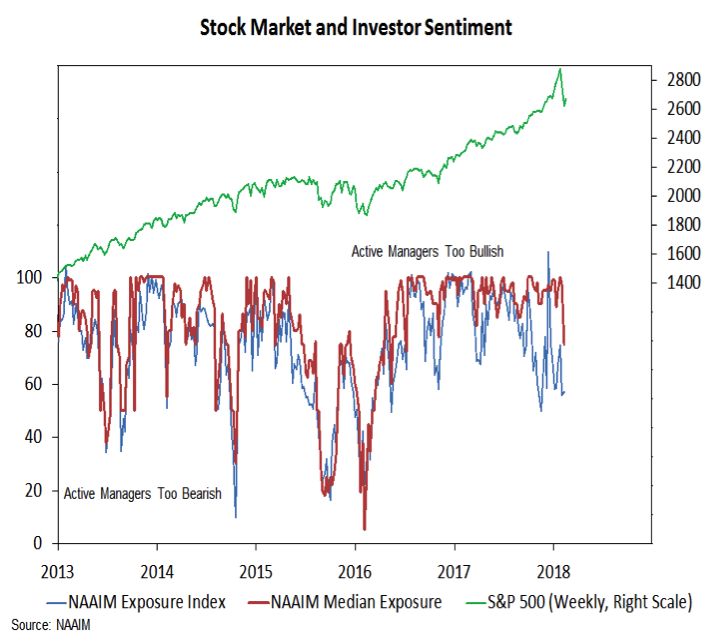
The good news from a sentiment perspective is that excessive optimism is ebbing, and that allows us to upgrade (to neutral) our view on investor sentiment. Active investment managers have reduced their exposure to equities. While the NAAIM Exposure index has been noise of late, the recent drop in median exposure (from 97% to 75%) could signal a meaningful retrenchment is underway there. Short-term trading sentiment composites quickly moved from excessive optimism to excessive pessimism as stocks weakened in early February, and the Ned Davis Research Crowd Sentiment Poll has backed away from record optimism and is nearing a neutral reading.
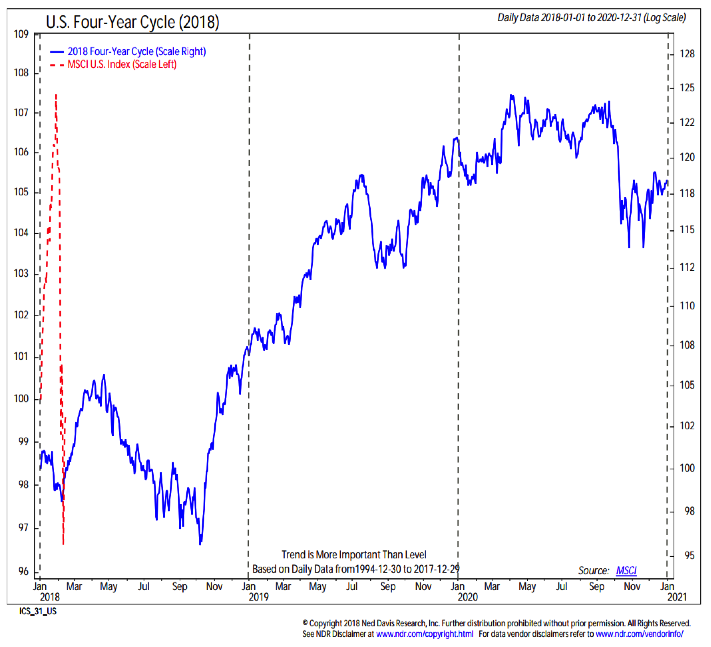
Seasonal patterns and trends have turned neutral. Expectations for heightened volatility this year rest not only with a return to a more normal environment after a quiet 2017, but also with seasonal patterns that suggest the recent market moves may just be hints of what is yet to come. The weakest stretch of the four-year Presidential election cycle are the six months prior to mid-term elections. Given the number incumbents announcing their retirement, and the possibiltiy that control of at least one house of Congress could change hands this fall, mid-term election winds are likely to blow hard this year. The good news is that after we clear this period, seasonal tailwinds could be at the back of stocks into 2020.
In addition to the mid-term election influences, stocks are also dealing with the effects of new leadership at the Fed. History shows that new leaders get tested by the market, with stocks having experienced a median pullback of 10% withing the first six months of new Fed leadership. The nature of the test is not known beforehand, but as mentioned above, the Fed currently has plenty of issues on which it is trying to maintain a delicate balance. It may not take much wavering on the part of Chairman Powell to find his time at the helm starting in similar fashion to his predecessors.
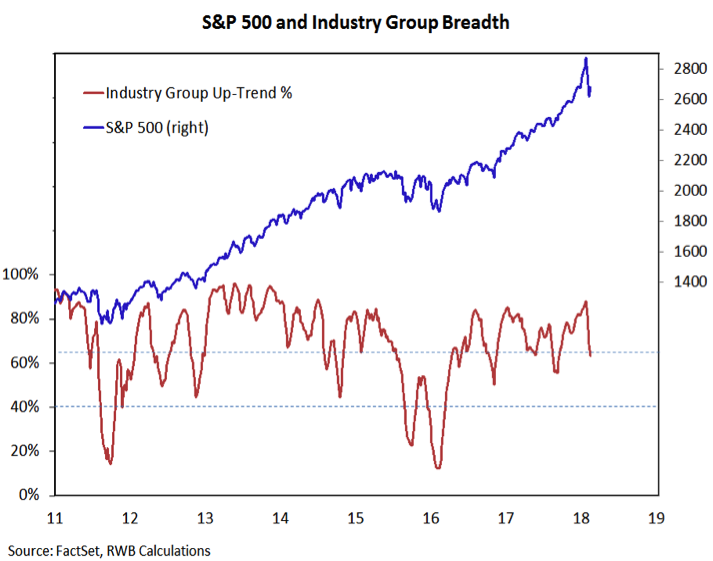
Breadth has shifted from bullish to neutral. Broad market trends faltered as stocks entered correction mode. The percentage of industry groups in uptrends has turned sharply lower, the new low list on both the NYSE and NASDAQ expanded to its highest level since early 2016 and downside selling pressure has emerged as the market experience multiple days in which downside volume exceeded upside volume by more than 9 to 1. Deteriorating breadth trends will make it harder for stocks to resume their upward trend.
The deterioration in trends comes at a time when, for the first time since the financial crisis, the broad market is not enjoying a momentum tailwind. Last year was the first year since 2007 that we did not see a sustained surge in the ratio between advancing issues and declining issues. These so-called ‘breadth thrusts’ have been historically reliable indicators of market strength that carries over the course of a year. The most recent breadth thrust came in November 2016, leaving stocks bereft of this tailwind as they entered 2018. To return breadth to the bullish camp, we likely need to see both stabilization in breadth trends and some evidence that upside momentum in the broad market has returned.
Twitter: @WillieDelwiche
Any opinions expressed herein are solely those of the author, and do not in any way represent the views or opinions of any other person or entity.


