It is a reasonable question and certainly top of mind after the yellow metal (gold) has declined from just over $2,000/oz in early August to $1,700/oz presently. This reflects a $100 drop in the past week alone and has occurred with the backdrop of unprecedented money printing.
The question about its broken state comes from a few perspectives. During this price decline over the past six months, the U.S. dollar has been generally weaker, usually a positive for bullion prices. In addition, inflation expectations have been rising. While this has not shown up yet in Consumer Price Index data, the market is increasingly leaning towards a higher inflation regime in the near term.
Yet, the gold price has fallen. Trumping these positive drivers are nominal yields, bitcoin and a better – or perhaps, less dire – world.
There is no denying that compared to six months ago, the world is in a better place. Vaccine shots are going into arms, there is enough stimulus that the economic recovery has solid momentum, and even politics have become more calm. We just heard that as of this week haircuts in Toronto are a go!!! Bitcoin is also a competing asset class that has recently gained in popularity. Both are variations of a currency – one based on a rare/difficult-to-extract metal, one on a hard-to-extract calculation. We won’t go into the nuances of the two but suffice it to say many gold enthusiasts are also crypto fans.
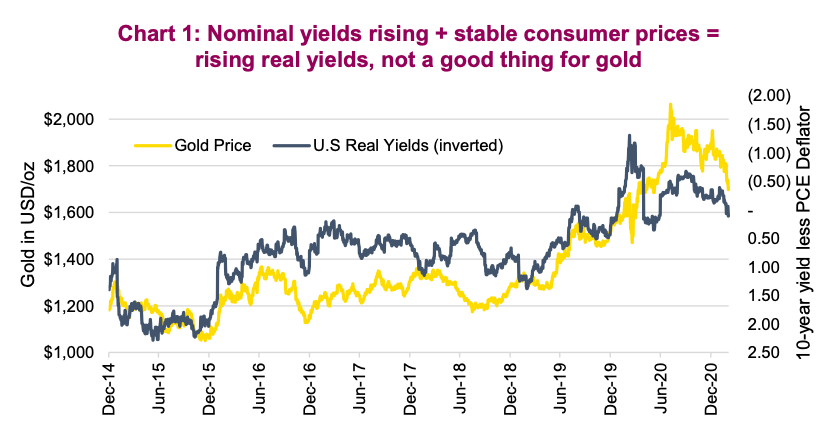
The biggest driver for the drop in gold prices is yields. With nominal yields starting to rise, coupled with inflation not rising yet, real yields (nominal yields minus inflation) have started to rise. At the moment this is trumping all other factors and putting downward pressure on the price of gold (Chart 1).
Where to next?
We continue to believe that bond yields will be in an upward trend. (See our recent research article: The yields they are a-risen’). However, given the strong move over the past few months, we do believe that much of any near-term uptick in yields has already occurred. And in the coming months we expect to see rising inflationary data. This should help alleviate some of the rising real yield pressure on gold.
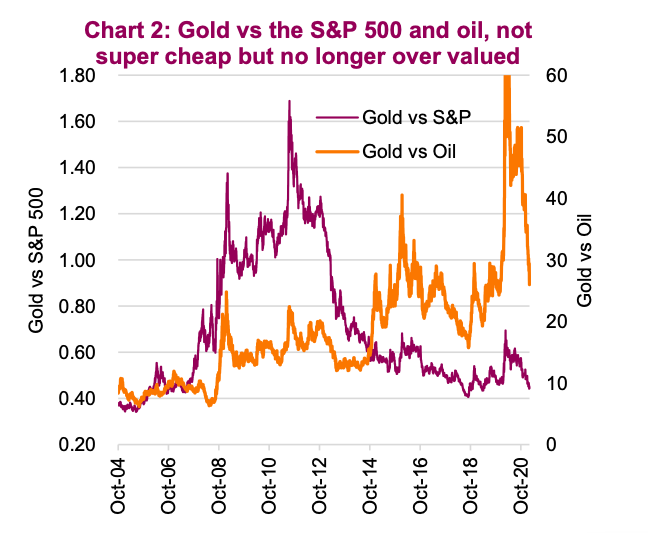
There is no valuation for gold. One of my favourate economists often says that gold is valued at 1/T, where T = Trust. Lack of trust or high levels of uncertainty during the pandemic certainly lifted gold prices. And recently, part of the decline in gold prices has been giving some of this uncertainty premium back. Chart 2 contrasts the price of gold against the S&P 500 and the price of oil. While this is truly an apples and oranges comparison, it does provide a lens for extreme valuation levels on the high or low side. Compared to the S&P, gold is attractively priced. Oil less so, but with oil prices climbing, this ratio is almost back to normal levels.
Technically, there is not a lot to get excited about. The trend is negative and key support was broken when spot prices fell through the mid-$1700s as well as the key retracement level of the 2018/2020 bull trend at $1726. The latter held for a period but has finally given way. Support from the upper end of the month-long tight range for the spot price last spring also proved fleeting; however the lower end of that channel has held for now. This is positive. The 50% retracement level from the 2018/2020 move also stands at $1617, well below current prices; however the rising trendline connecting the 2019 lows and 2020 lows is intersecting with current spot levels. Positionally, Commodity Futures Trading Commission (CFTC) position data shows the net long from extreme levels last summer continues to unwind but still has scope to unwind further should sentiment continue to deteriorate.
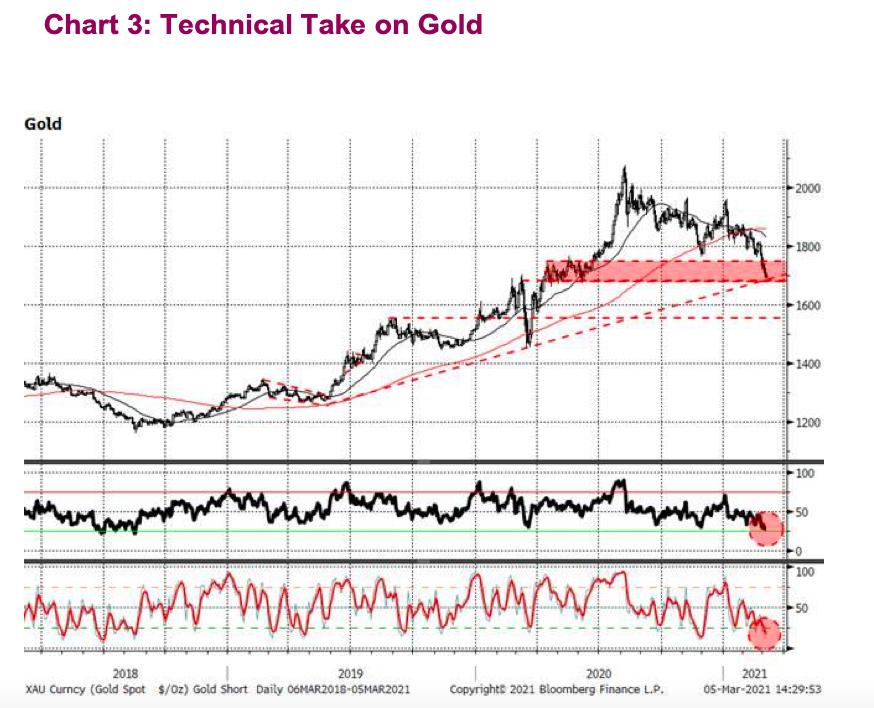
At the moment, contrarians with a golden itch are likely eyeing the oversold momentum readings as a prime time to act. With some measures reaching extreme levels last seen during the lows of 2016 and 2018. Given the overwhelming embedded short-term trend strength, there is clearly some risk in trying to grab the golden knife, but that is when return potential is the greatest. Overall, the technical picture is mixed, the long-term trend is still intact, but barely so, and the short-term trend is negative but likely overdone.
Investment implications
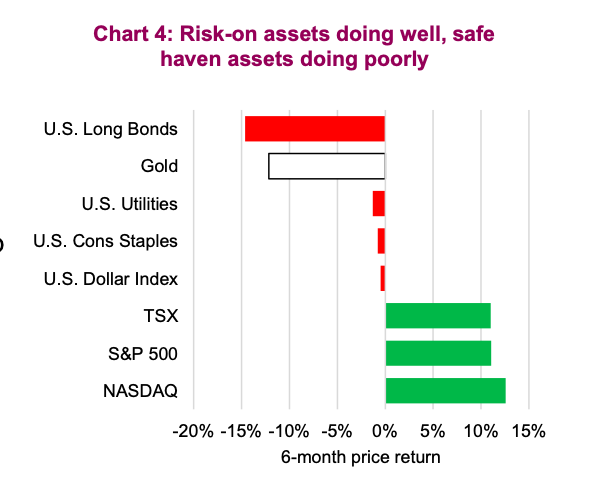
Let us not forget, the world has improved over the past six months which has weighed on safe-haven assets and boosted risk-on assets.Gold isn’t the only safe haven asset to suffer (Chart 4). This should help remind investors why they own gold—for troubled times. That being said, after such a decline, the contrarian in us certainly sees gold and gold equities at these levels as attractive. It is worth noting that the recent decline in bullion prices over the past few days has seen gold equities stable or even rising. The equities often lead the commodity.
Source: Charts are sourced to Bloomberg L.P. and Richardson Wealth unless otherwise noted.
Twitter: @ConnectedWealth
Any opinions expressed herein are solely those of the authors, and do not in any way represent the views or opinions of any other person or entity.
")


")
