It’s no secret that one of the biggest laggards within the equity market over the past 5 years has been the precious metals & mining group. After a blowoff top in 2008, the space absolutely cratered. Following the broad stock market bottom in 2009, the sector rallied along with the rest of the market. Using the SPDR S&P Metals and Mining ETF (NYSEARCA:XME) as a proxy, the group rallied some 350% into 2011. As an idea of how bad the 2008 drop was, however, it would have taken a 450% precious metals & mining rally to get back to the XME’s 2008 highs.
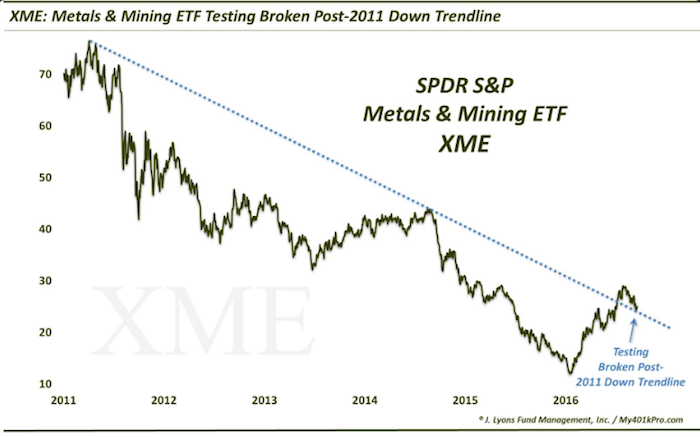
Since 2011, it has been nothing but downhill for the XME. Eventually, in the late 2015-early 2016 decline, the XME even broke below its 2008 lows. Fast forward to today and we do see some reasons for optimism, however. First off, the undercut of the 2008 low was recovered by March of this year, presenting a potential “false breakdown”. Furthermore, we have seen follow-through in the XME’s rally off of its low. And in July, the XME broke above the Down trendline connecting the 2011 and 2014 highs, on a linear chart. I covered that breakout here.
That gave an additional boost to the ETF, temporarily.
After topping in late July-early August, the XME has pulled back a bit. This isn’t overly concerning or unhealthy. Nothing goes in a straight line and this move has relieved its overbought status. Whether the precious metals & mining ETF recommences its uptrend is another matter. But we have seen something encouraging this week, as shown in this chart. The ETF was able, for now, to bounce off the top side of the broken post-2011 trendline. Theoretically, once resistance is broken, it then becomes support. That has been the case, so far. This development also gives us confidence in the validity of the trendline as it “respected” it, or moved off of it upon contact.
The XME has plenty of resistance to get through as it attempts to move through all of the post-2008 overhead supply. That include relevant Down trendlines on a log scale chart. However, the fact that the XME has rebounded off of this post-2011 Down trendline is a positive in a potentially longer-term developing turn.
Thanks for reading.
Twitter: @JLyonsFundMgmt
The author does not have a position in mentioned securities at the time of publication. Any opinions expressed herein are solely those of the author, and do not in any way represent the views or opinions of any other person or entity.
: Showing Some Signs of Emerging Strength")


: Showing Some Signs of Emerging Strength")