“Pulling Awesome Forward”, printed on inauguration day, discussed how markets had priced in a lot of good with the S&P 500 rising ~8% since the election. You can read that post here. A number of economic “positives” including infrastructure spend, tax reform, healthcare reform, and deregulation built a relentless bid in equity markets. And, a myriad “negatives” were being ignored such as dollar strength, the global debt bubble, Fed divergence, rising populism in Europe, low but rising risk of Euro-exits, protectionist leanings, and U.S. equity valuations at the third highest level ever on a PE10 basis.
In effect, the market was pulling a lot of awesome forward.
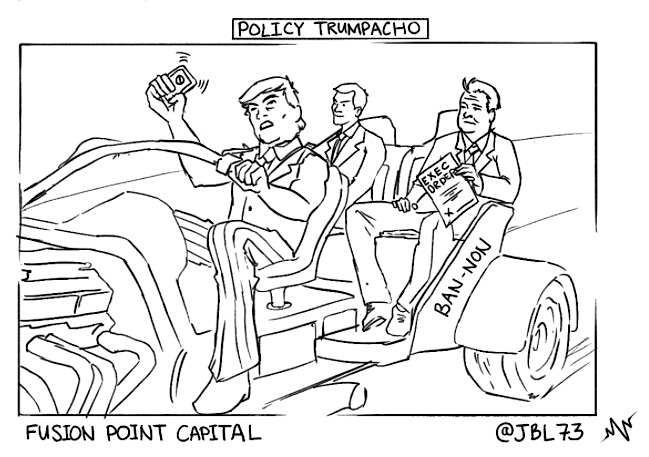
We sit at essentially the same level in the S&P 500 two weeks later – volatility compression continues despite rising policy risk as Trump’s 24/7 no holds barred “Policy Trumpacho” style is ruffling feathers on both sides of the isle and around the world (remember Italian, Austrian, Dutch, French, German and Italian elections are around the corner with the fate of the Euro Zone hanging in the balance).
Let’s take a look at valuation.
There has been much talk on the TV these last few months: (i) how valuations don’t matter, (ii) how it is about sector rotation, and (iii) how making America great again is going to unleash financials, industrials, materials, energy, etc. I’ve read fundamental and technical research and attended conferences with virtually no mention of potential downside. How could there be when everything is “breaking out” (healthcare be danged) and a cursory glance at the omniscient forward multiple on the S&P 500 is barely above the historical 16.5x mean, at a warm porridge just right 18x.
Furthermore, it is argued, that since we have moved from dirty to digital, smokestacks to server racks, margins have expanded and rendered useless any historical comparison of today’s valuation multiples to the 1980s or aghast, the dirty 1960s-1970s – pre-steroid era…pre-concussion protocol…hide yo kids, hide yo wife…they’re canceling CFA Level II study courses around here…
In the mid-60s, at the height of “dirty”, U.S. profit margin from current production hit 14% (with a trailing P/E of 18x). It declined to a low of 7% in the late ‘80s (P/E of 18x), rose to 14% in 2006 (P/E of 18x), declined substantially during the crisis, and is 14% as of 3Q16 (but with a P/E of 22x). The profit margin trend has no doubt been up since computerization in the 1990s, but cyclicality remains. So, “digital” profit margins today are the same as they were 10 years ago, before the iPhone, and the same as 50 years ago, before Apollo 11 landed a man on the moon with processing power less than an iPhone. The difference is the price paid today for those margins is 20% higher. I get it, this time is different because it’s not different…
So, let’s hold on to the CFA study courses and assume there is still merit to fundamentals, throw in some charts (sacrilege), and look at where we are. We’ll start with the macro (equity risk premium) and move to some micro examples of what happens when reality bites.
In Pulling Awesome Forward, I discussed PE10 (cyclically adjusted PE multiple over 10 years). The measure now stands at 27.9x vs. 8.6x at Reagan’s inauguration. A 50% decline in interest rates provided six years of PE expansion and a 200% rise in the S&P 500 from 1982-1988. We face the opposite scenario now from the 1980s – today we are in a rising rate environment potentially compressing PE and thus equity markets.
Let’s add a look at chart of Equity Risk Premiums by my colleague Arun Chopra, CFA CMT.
I summarize the chart here:
- The equity risk premium (ERP) is the amount equity investors can expect to earn over the risk free rate (i.e. 10-year Treasury). This is thought of as the excess return received for the risk of holding stocks vs bonds.
- It can be computed by subtracting the yield on the 10-Yr from the earnings yield (E/P).
- Note the crush in ERP from 4.37% in 2010 (high earnings yield) to 1.2% today (low earnings yield and rising 10-Yr yields).
Also note that at a 10-Yr yield above 3.0%, the ERP goes below 1.0% – said again, the amount investors can expect to earn over the “risk free” 10-Yr Treasury is below 1% when the 10-year goes above 3%.
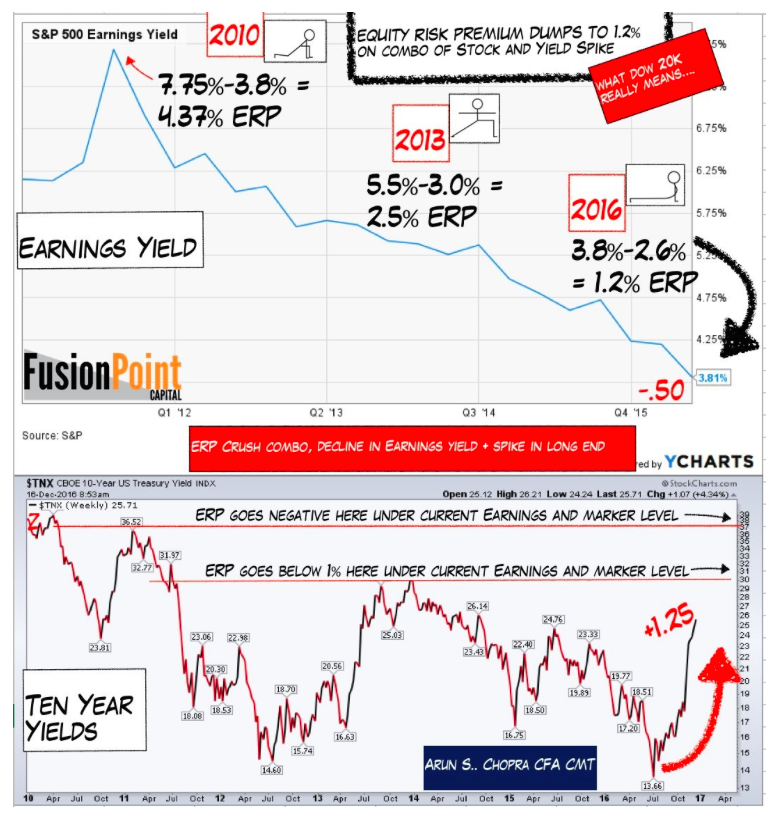
Using ERP as a guide, we see what Dow 20k and the spike in yields really mean – valuation extremes and low return for risk.
continue reading on the next page…


