As many of you know I have a deep appreciation for point and figure charting. The main reason I like it so much is that it focuses on the most important aspect of the market, which is price action.
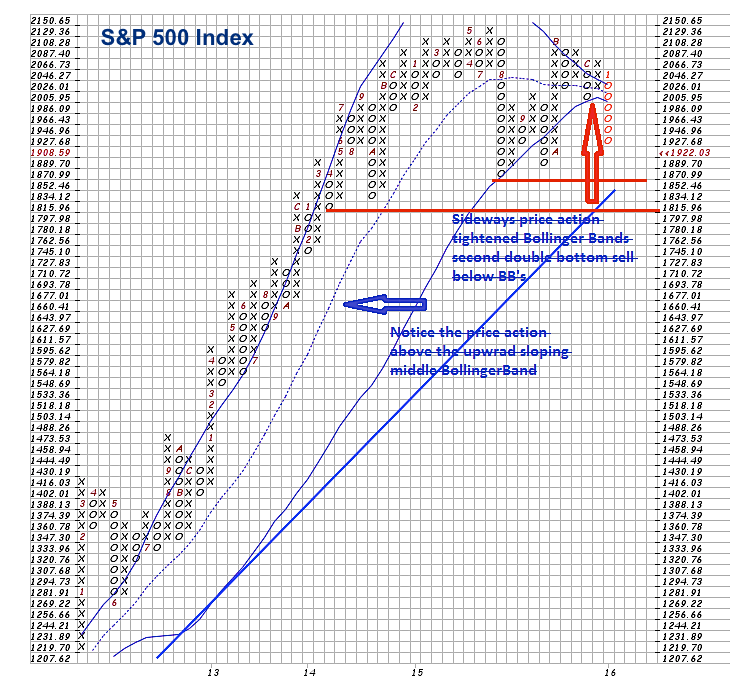
I’ve posted on the S&P 500 (SPX) before, but I wanted to do something a little different this time out. Instead of using daily price, I took a look at the price action using the weekly data for the S&P 500. The point and figure chart parameters are high/low price data using one percent as the box size and a three box reversal.
Looking at the point and figure chart below we see a strong market uptrend starting in July 2012, which did not generate a sell signal until October 2014, quite impressive to say the least. After some downward selling pressure, the trend resumed higher with a double top buy signal that was generated in November of that year. After that buy signal, the market continued higher, but the dynamics of the price action began to change. Instead of marching higher, the stock market began more sideways movement and a flattening slope of the Bollinger Bands was occurring.
In August 2015 the S&P 500 signaled a double bottom sell and momentum carried price to the lower Bollinger Band before seeing any type of bounce in price action. In September we saw a double top buy signal that immediately gave way to another double bottom sell signal and break below the lower Bollinger Band. At this time it was clear that we transitioned from a strong bull market rally to at least a minimum of a meaningful correction (if not a complete reversal in trend).
When it looked as if there would be continued selling in the months ahead, the S&P 500 turned upward and signaled a double top buy in October and continued upward movement lasting until November. Unfortunately, the S&P 500 failed to make new highs and price action once again gave way to the downside for the stock market. In December we had a double bottom sell signal generated followed by last week’s double bottom sell signal that occurred below the tightened Bollinger Bands and continued momentum to the downside.
The stock market in terms of the S&P 500 is now in a corrective mode confirmed by the two double bottom sell signals occurring back to back on the point and figure chart. The current downside price objective using last week’s sell signal is 1836.91 that would take out the low made in August and in my opinion confirm a new established downtrend for the S&P 500.
A positive for bulls at this point is that we are still above the August lows and the long term trend line for the stock market is still intact.
S&P 500 (SPX) Point and Figure Chart – Weekly
Thanks for reading.
Twitter: @Snyder_Karl
The author does not have a position in any of the mentioned securities at the time of publication. Any opinions expressed herein are solely those of the author, and do not in any way represent the views or opinions of any other person or entity.


: Showing Some Signs of Emerging Strength")
