 By Brad Tompkins
So far in this series we’ve introduced option fundamentals along with a speculative bullish call trade, explored protective put options as a way to hedge portfolio positions, and saw how writing covered calls can be used for protection and income. Buying calls or puts are great ways to establish very bullish or very bearish positions while strictly defining risk and limiting capital outlays. On the other hand, selling option premium in the form of covered calls works as a nice strategy in the instance of mildly bullish/bearish outlooks. Today, we’ll dig into using option spreads as a way to best exploit the middle ground of moderate price move forecasts.
There are a great many types of option spread trade strategies. All spreads involve buying a number of option contracts and then offsetting those by selling other option contracts. Just for fun, let’s list the spread categories to give you an idea of the extreme variety of choices:
- Bullish, Bearish or Neutral Spreads to match speculative direction expectations.
- Credit or Debit Spreads depending if you desire collecting more option premium than paying.
- Call Spreads or Put Spreads and even combinations of both.
- Vertical Spreads → same expiration period but different strike prices.
- Horizontal (Calendar) Spreads → same strike price but different expiration periods.
- Diagonal Spreads → different strike price and expiration (Vertical & Calendar combined).
Is your head spinning yet? And we didn’t even mention Condors, Butterflies, & Ratios. No matter. For the most part, if you can understand one of the more straightforward option spread constructions, all the rest are variations on the common theme. We don’t have to make the concept more difficult than it is.
Trade Setup: A Moderately Bullish Forecast for IWM
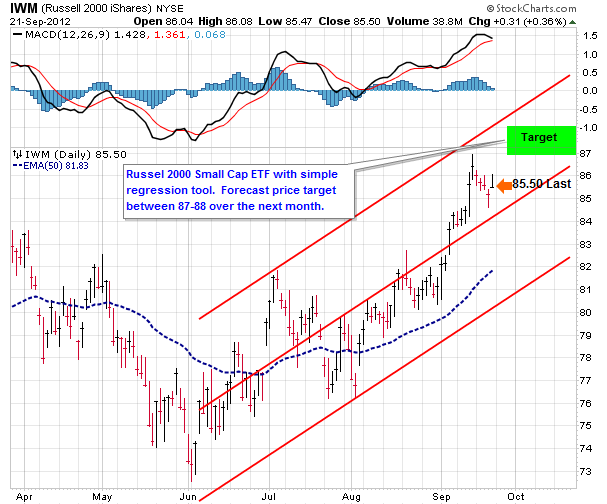
If I bring up the Russell 2000 small cap ETF (IWM), I can simply extend the trend since June using a regression tool and come up with a reasonable price forecast for where price may be in the next month – see chart below. (Please perform more rigorous technical analysis when you are studying trade setups on your own!)
Analyze the Choices for Executing the Trade
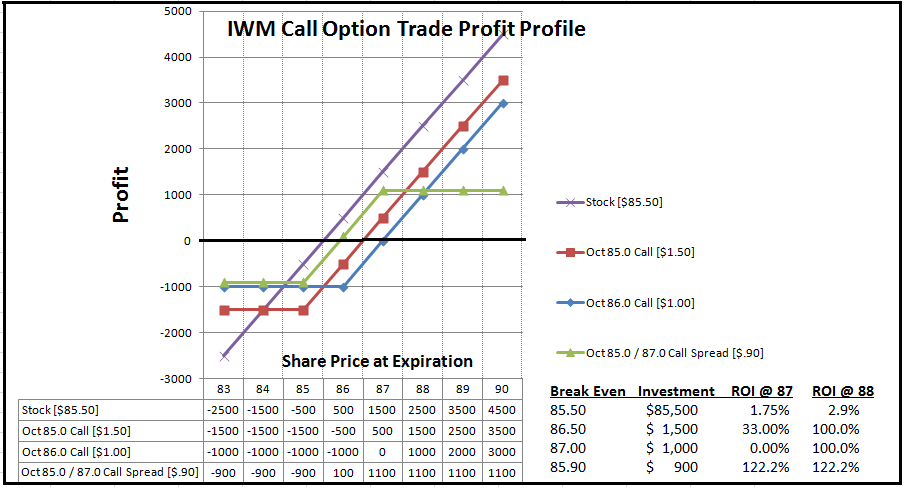
The moderately bullish $87- 88 IWM price target can be traded in many ways: we can buy 1000 shares of IWM; we could buy 10 in the money October 85.0 Calls; or possibly buy slightly cheaper just out of the money October 86.0 Calls. Which to choose? We know the most bullish trade would be to buy the shares outright and trail with a stop loss. However, we might be a little nervous with the $85k capital outlay in light of the impressive 17% upward move since the June low. There could easily be some backing and filling to the 50 day moving average and/or bottom of the regression channel which means my back-of-the-napkin risk/reward looks something like $4 on the downside with $2 on the upside. That isn’t stellar.
Let’s also complicate the picture with a fear of missing out on additional gains given the recent massive central bank stimulus activity. With that new condition, I then might be leaning toward bullish option trades where I don’t have to tie up a lot of capital to participate in higher prices yet can maintain strict loss limits by only risking the option premium paid. When I open the IWM option chain to view current call premiums, the Oct 85.0 calls can be bought for close to $1.50 and the Oct 86.0 calls are around $1.00. I can do the breakeven math (call premium + strike price) to come up with $86.50 and $87.00 respectively. Those breakeven prices get a less than compelling nose scrunch because they don’t leave quite enough upside. My IWM target range is barely above that and I haven’t even factored in commissions and bid/ask slippage.
Anatomy of a Vertical Call Spread
Wouldn’t it be nice to have a way to skew the risk/reward a bit more in my favor? Hint, hint I’m already planning to take profits at the target area anyway and am fully willing to sacrifice IWM gains over $87 -88. Cue drum roll and Ta-Dah! Enter the Bullish Vertical Call Spread. I can buy the Oct 85.0 calls for $1.50 and sell the Oct 87.0 calls for $.60. My net option premium paid would be $.90 which means the position breakeven is now lowered to $85.90. That risk/reward is much closer to the area where I’m willing to play — $.90 on the downside and $1.10 on the upside.
Below is a typical risk profile graph with the four trade choices we’ve discussed. Profit is on the vertical axis with the various IWM prices at expiration in the horizontal axis. The risk profile is a nice way to visualize what the trading outcomes might be. You can quickly identify the breakevens (where the lines cross 0) as well as the profit & loss levels across a wide price spectrum. I’ve also included the full profit data table to go along with the graphic and added additional calculations for % return on investment (profit divided by capital outlay; not annualized).
Vertical Call Spread is a Great Solution for Moderately Bullish Speculative Trades
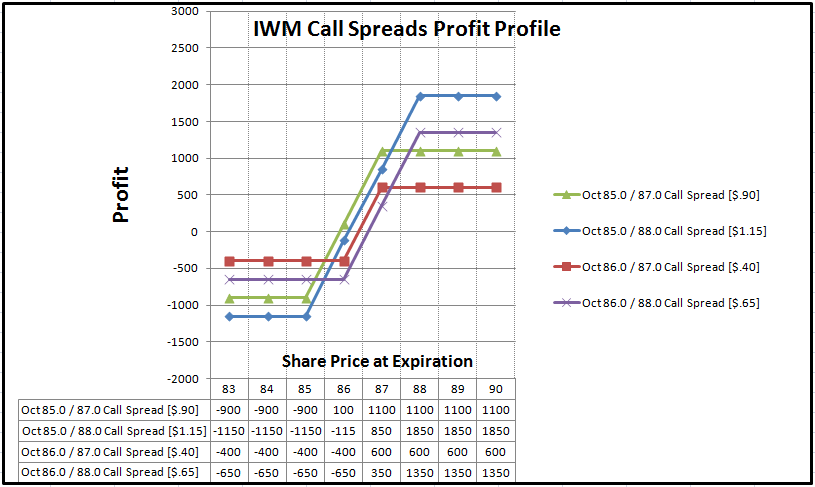
The important concept on the Vertical Call Spread trade is that the short leg (sold 87.0 calls in our example) reduces net cost in the trade but limits potential gains on the upside. I could have chosen several different combinations of long and short strike prices each producing a slightly different profile. Here’s what profits on those other IWM Bull Call spreads look like:
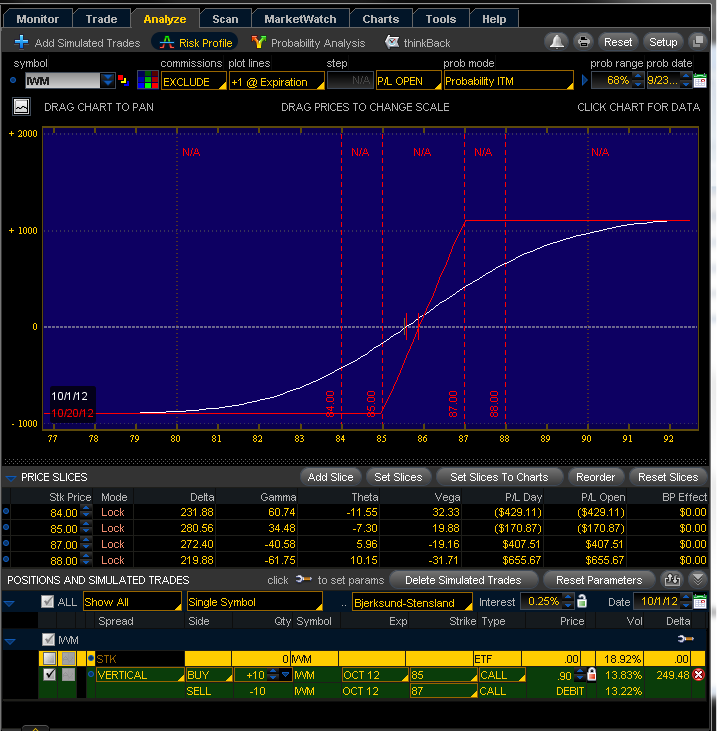
Lastly, keep in mind that the shape of the profit profile prior to expiration is stretched out horizontally because the time value in the calls doesn’t leak out until expiration. For that reason, the gains and losses are slow to change while expiration is still a long time away. The math is fairly easy, but fortunately my trading desk (thinkorswim) does a great job crunching all the numbers and displaying the results. Here’s (below) a snapshot of the software showing a quick comparison of the profit curve on 10/1/2012 (the white line) for the IWM 85.0 / 87.0 Bull Call Spread vs. the 10/20/2012 expiration day profit curve (red line). Case in point is if IWM hit 87 on 10/1/2012, the option spread profit would be around $407.50 which is considerably less than the $1100 profit if IWM is at 87 on expiration day.
In recap, the Bull Call Vertical Spread fits into the sweet spot for an option trade suiting a moderately bullish forecast. As with any new strategy, stay small or paper trade to get the feel of it. Dividend payouts and earnings announcements complicate the spread trades and may want to be avoided until you are more advanced.
Recent Options Articles by Brad Tompkins:
Introduction to Trading Options
———————————————————
Twitter: @BBTompkins and @seeitmarket Facebook: See It Market
No position in any of the securities mentioned at the time of publication.
Any opinions expressed herein are solely those of the author, and do not in any way represent the views or opinions of any other person or entity.


