A couple weeks ago, I wrote an article about crude oil’s recent correlation to the S&P 500 (stock market) and that its initial move lower may be sending a bearish signal to stocks.
Since then, crude oil has fallen sharply through its up-trend line, sending a bearish message to Oil bulls.
Is the S&P 500 the next to fall?
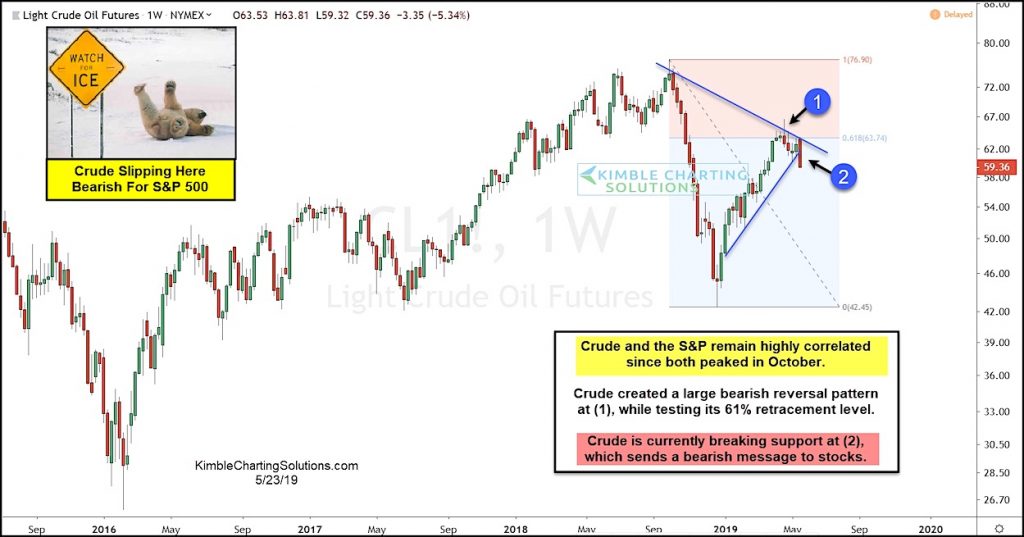
Below is an updated chart of Crude Oil showing the multi-month downtrend (1), and the ultimate break down through its near term up-trend line (2).
More importantly, from a pattern perspective Crude Oil is putting in a large weekly reversal bar (bearish).
This warrants watching as Crude Oil and the stock market remain highly correlated since their peak in October. Stay tuned!
Crude Oil Chart “weekly”
Note that KimbleCharting is offering a 2 week Free trial to See It Market readers. Just send me an email to services@kimblechartingsolutions.com for details to get set up.
Twitter: @KimbleCharting
Any opinions expressed herein are solely those of the author, and do not in any way represent the views or opinions of any other person or entity.


