Crude oil prices tend to offer a good general barometer for the global economy.
More specifically, it is the trend of crude oil that matters.
When demand is high and the economy is strong, crude oil prices tend to move higher… and the trend tends to be “up”. And this tends to be a tailwind for the stock market. When crude oil prices head lower, it is bearish and is a headwind for the stock market.
In today’s chart, we examine this theory by charting the S&P 500 Index next to Crude Oil prices.
Although the correlation isn’t perfect, it does work as a good confirmation indicator.
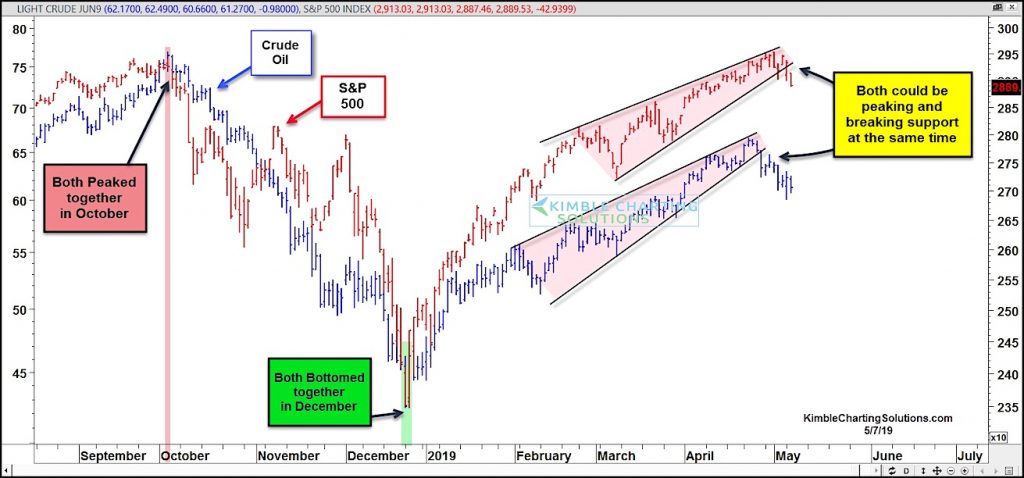
As you can see in the chart below, both the S&P 500 and crude oil peaked in September together, bottomed in December together, and appear to be peaking together this spring. Both broke near-term support and fell out of rising wedge patterns, a bearish near-term signal for investors.
Stock bulls may be getting an important message from Crude Oil of late!
Crude Oil vs S&P 500 Chart
Note that KimbleCharting is offering a 2 week Free trial to See It Market readers. Just send me an email to services@kimblechartingsolutions.com for details to get set up.
Twitter: @KimbleCharting
Any opinions expressed herein are solely those of the author, and do not in any way represent the views or opinions of any other person or entity.


