The following is a recap of the November 4 Commitment Of Traders (COT Report) released by the CFTC (Commodity Futures Trading Commission) looking at COT data and futures positions of non-commercial holdings as of November 1.
Note that the change in COT report data is week-over-week. Excerpts of this blog post originally appeared on Paban’s blog.
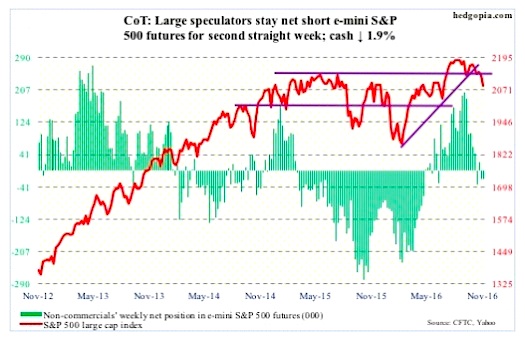
E-mini S&P 500: In the week through Wednesday last week, the SPDR S&P 500 ETF (NYSEARCA:SPY), attracted $1.3 billion (courtesy of ETF.com); yet, the S&P 500 (INDEXSP:.INX) for the whole week dropped 0.7 percent. This week, there were outflows of $1.1 billion – and the S&P 500 went on to lose another 1.9 percent.
Support at 2120 was lost. This support/resistance goes back to February last year. In September and October this year, 2120 was tested several times and held. Not on November 1. The loss of this price point preceded the loss last week of a rising trend line drawn from February this year.
Also in the week to Wednesday last week, a whopping $16.6 billion came out of U.S.-based equity funds (courtesy of Lipper). This week, another $3.4 billion was redeemed.
On a related note, NYSE margin debt jumped 6.3 percent m/m in September to $501.1 billion. The S&P 500 was down 0.12 percent in that month. Turns out it was a bad time to lever up as the S&P 500 is down 3.8 percent since September-end.
The S&P 500 has lost two crucial levels – 2120 and the February trend line. It is currently sitting at the 200-day moving average, which has not been tested since the Brexit low in June this year. It is a must-hold.
November 4 Commitment Of Traders data: Currently net short 20.7k, down 743.
VIX Volatility Index: Protection is in high demand.
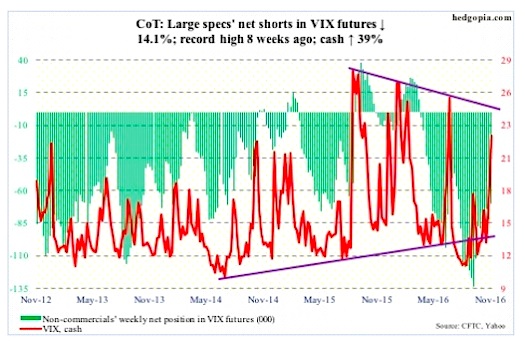
For the first time ever, spot VIX Volatility Index (INDEXCBOE:VIX) has rallied for nine consecutive sessions – from an intra-day low of 12.73 to a high of 23.01 (closed at 22.51). Daily momentum indicators are grossly overbought, but a spike reversal signal is yet to flash.
In the meantime, at 1.07, the VIX-to-VXV ratio is well into overbought territory.
In the right circumstances, both spot VIX and the ratio have room to drop to unwind overbought conditions. But it needs a catalyst, a trigger. Tuesday next week is the U.S. election.
November 4 Commitment Of Traders data: Currently net short 70k, down 11.5k.
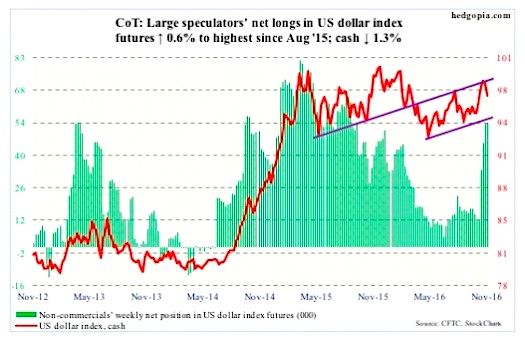
US Dollar Index: Since the early-May (2016) low, the dollar index (cash) has been trading within an ascending channel, the upper end of which was tested last week – unsuccessfully. This week, it lost 1.3 percent.
If it proceeds to test the lower end of the channel it is in, the cash (97.09) could be headed toward 96.
In a larger scheme of things, it continues to trade within $100-plus and $93-plus.
November 4 Commitment Of Traders data: Currently net long 54.3k, up 340.
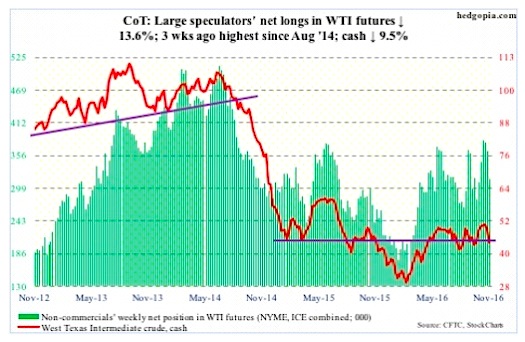
Crude oil: In the EIA report this week, traders decided to focus on crude stocks and imports, not on gasoline and distillate stocks. On Wednesday, spot West Texas Intermediate crude dropped 2.9 percent to $45.34/barrel – past $46.40-ish support, and then lost another 2.8 percent on Thursday and Friday to $44.07.
In the week through November 2, crude oil inventory rose by a massive 14.4 million barrels to 482.6 million barrels – a nine-week high.
Crude oil imports increased by two million barrels per day to nine mb/d. This was the highest since the week through September 14, 2012.
Gasoline stocks, on the other hand, fell by 2.2 million barrels to 223.8 million barrels – the lowest this year. And distillate stocks dropped by 1.8 million barrels to 150.6 million barrels – a 17-week low.
In the meantime, crude oil production rose a tad, by 18,000 b/d to 8.5 mb/d – a 10-week high. Production peaked at 9.61 mb/d in the June 5th week last year.
Refinery utilization fell four-tenths of a point to 85.2.
The loss of $46 on WTI crude oil breaches the rising trend line from February this year – potentially important development. For now, the crude is oversold. At Friday’s low, it was merely 0.4 percent from testing the 200-day moving average ($43.38). Oil bulls cannot afford to lose this support.
November 4 Commitment Of Traders data: Currently net long 314.4k, down 49.6k.
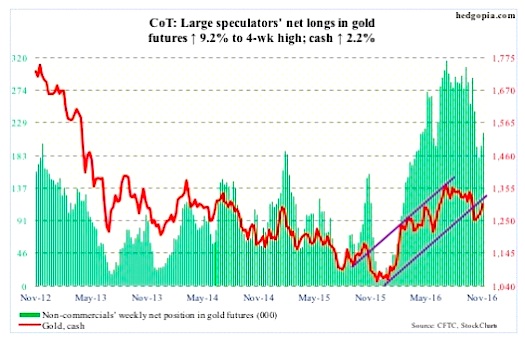
Gold: The $1,300-plus/ounce level has proven to be important for gold prices. It provided support in June through September this year. This support/resistance can be extended as far back as September 2010.
On October 4, once $1,300 was lost, spot gold prices collapsed 3.3 percent, followed by a long stretch of hovering around the 200-day moving average. Then came the liftoff. On Tuesday and Wednesday, gold rallied 2.8 percent to $1,308.2 – past the 50-day moving average but right at the said resistance.
A declining trend line drawn from the July high will be tested around $1,330.
On a weekly chart, there is room for gold prices to rally, but daily conditions are way overbought.
Flows are not cooperating. In the five sessions through Wednesday, gold rallied 3.3 percent, the SPDR gold ETF (NYSEARCA:GLD) saw activity only once – inflows of $109 million on Tuesday. From October 7 when the metal began to rally, it lost $107 million (courtesy of ETF.com).
November 4 Commitment Of Traders data: Currently net long 215.1k, up 18.2k.
Thanks for reading.
Twitter: @hedgopia
Author may hold a position in mentioned securities at the time of publication. Any opinions expressed herein are solely those of the author, and do not in any way represent the views or opinions of any other person or entity.


