The S&P 500 (NYSEARCA: SPY) still maintains a bearish posture (green line on Market Forecast indicator below) but its intermediate line is below the 20th percentile (oversold territory) and it usually doesn’t spend a lot of time down at those levels – unless you are at the tail-end of a “death cross” correction.
The S&P 500 is trading near a confluence of support levels using Fibonacci retracements and Fibonacci fans of the bullish run that started late last year and the late March pullback that produced a weak intermediate low point.
There’s also strong volume support between 2780 and 2800.
None of the major stock market indexes are forming oversold clusters despite the intermediate line sitting below the 10th percentile on the NASDAQ (NASDAQ: QQQ) and Russell 2000 (NYSEARCA: IWM).
The Russell 2000 has dropped towards its 38% Fibonacci retracement level and appears to be trying to find a low near these levels.
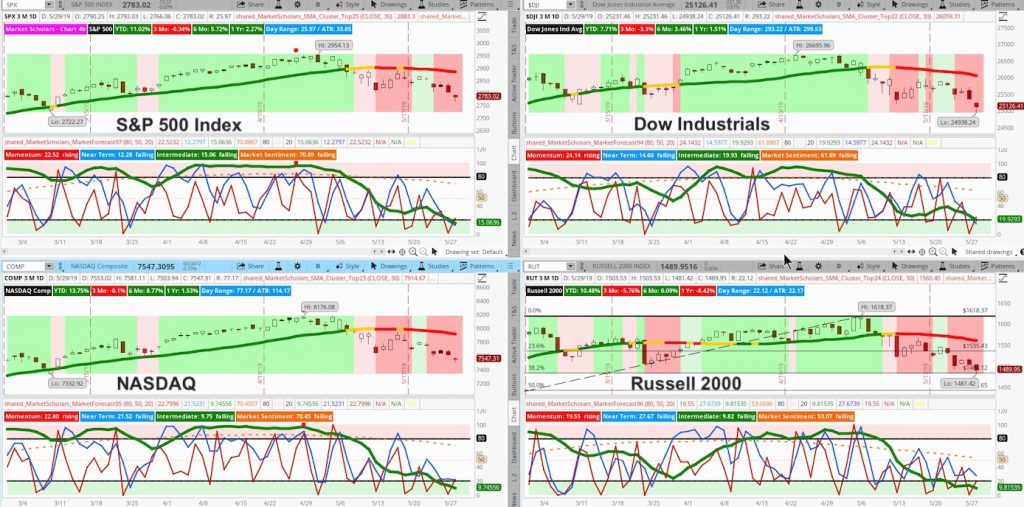
The MACD and Stochastic indicators are below their respective chart’s midpoints but not at levels that suggest we’re doing anything more than a normal pullback. Like the Market Forecast’s intermediate line, the Stochastic level is also sitting in its lower-reversal zone and usually doesn’t spend a lot of time there.
Get market insights, stock trading ideas, and educational instruction over at the Market Scholars website.
Stock Market Video – For the Week of May 29, 2019
The depth and length of this month’s pullback are a function of the extended 25% rally off the Christmas Eve lows and the discomfort of the pullback is offset by the lack of discomfort in the prolonged rally that went a couple of months longer than normal after getting the “golden cross” earlier this year.
Today’s trading range and volume do not suggest that today’s move was anything more than average.
In fact, the VIX Volatility Index (INDEXCBOE: VIX) started the day above 18 but finished below despite the S&P closing much lower than its May 13 low where the VIX closed above 20 the only day during the pullback.
Twitter: @davidsettle42 and @Market_Scholars
Any opinions expressed herein are solely those of the author, and do not in any way represent the views or opinions of any other person or entity.

: Showing Some Signs of Emerging Strength")
