The Nikkei 225 rally off the 2009 lows ran into a wall in January.
The major Japanese stock market index has been pulling back ever since.
In today’s featured chart, we’ll take a closer look and highlight why the Nikkei is at a critical juncture.
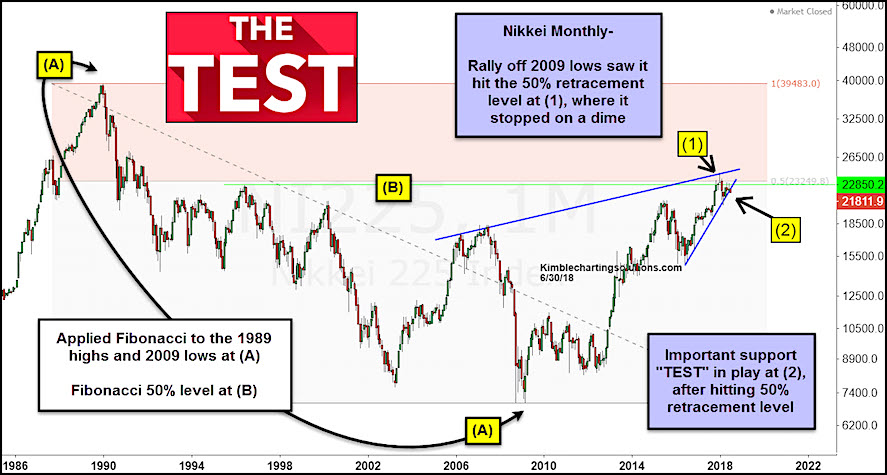
That wall of resistance I referred to earlier represents the 50 percent fibonacci retracement level (B) of the 1989 highs to 2009 lows (A).
In January, the Nikkei poked its head just above this resistance area (1) and reversed lower.
It’s now testing its current multi-month rally up-trend line (2). If this fails to provide support, the Nikkei would likely head lower.
As well, the Nikkei has formed a rising bearish wedge pattern.
In any event, caution / hedging may be warranted here until a definitive breakout to new highs.
Nikkei 225 Stock Market “monthly” Chart
Twitter: @KimbleCharting
Any opinions expressed herein are solely those of the author, and do not in any way represent the views or opinions of any other person or entity.


