Natural Gas has gotten plenty of attention with volatile moves during the latest polar vortex. Prices are down 12% this week as of this writing. Is the rally over? Or was the recent move higher the first leg of a larger move? Let’s dig in.
Looking into the chart, a few things stand out. First, there is a major confluence of support around the 3.90-3.95 area. This is the most important area on the chart.
Not only do the rising 20 and 50 day moving averages meet there, but 3.93 is also the .618 Fibonacci retracement level. Just below that is a four touch trend line that should be respected between August and October. If you’re looking for a bounce area to get long for a trade, this is probably it.
Natural Gas Daily Spot Price Chart
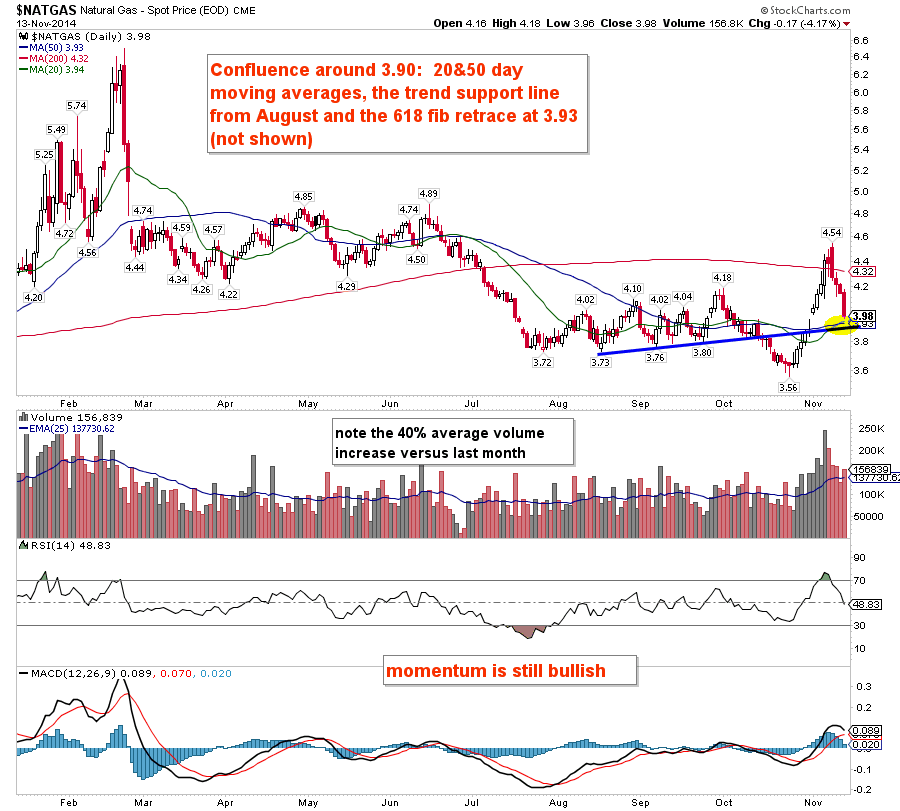
It’s also worth noting the MACD and RSI have recently shifted to higher ranges suggesting momentum has turned bullish. They maintain a bullish posture even with this week’s pullback. Finally, average volume has jumped to levels not seen since last winter. Tis the season to trade nat gas!
Other downside levels worth noting: 3.80, 3.73
Upside levels worth noting: 4.02, 4.10, 4.18, 4.32
Regardless of market direction, we will learn a lot about this market just based off the action around the key 3.90-3.95 area. Note as well that Natural Gas can also be traded through its popular ETF United States Natural Gas (UNG). Thanks for reading!
Follow Aaron on Twitter: @ATMcharts
No position in any of the mentioned securities at the time of publication. Any opinions expressed herein are solely those of the author, and do not in any way represent the views or opinions of any other person or entity.

: Worrisome to Broader Market?")
