May temperatures came in modestly below average (slightly bearish) for the contiguous United States, though June had been telegraphed to be warmer than average (bullish).
Thus far, the cooler trends have persisted through the first full week of the month, disappointing the bulls.
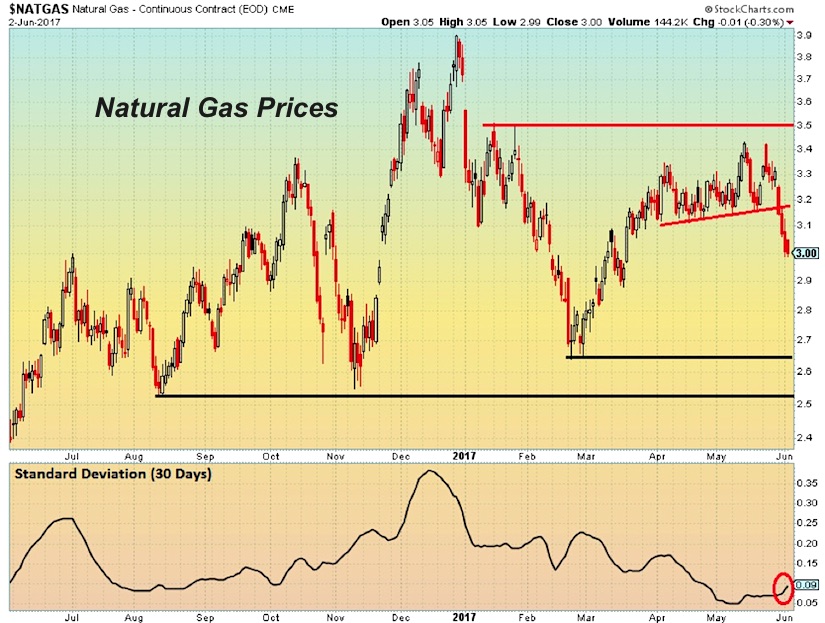
This fundamental weather catalyst is reflected in the recent price action of Natural Gas (NG) – see the chart below and recent decline. Prior to the decline, Natural Gas experienced a rangebound period of low volatility.
With this in mind, I charted Natural Gas prices using the Standard Deviation metric, which is a gauge of volatility. The volatility gauge dropped to 5% for the first time in more than 18 years last month!
So how can traders use this?
It is believed that a trader should watch for the breakout or breakdown once the low volatility period is disrupted. In the case of last week, Natural Gas broke down from $3.15-$3.40 range in which it had been trading since April, along with its volatility ticking back up. Volume was also higher in the breakdown than in recent weeks. A popular term for a breakdown over several days on above average volume is “distribution”. The support levels are unchanged near $2.50-$2.65.
Natural Gas 1-Year: Last Week’s Distribution with Uptick in Volatility
Thanks for reading.
Twitter: @MikeZaccardi
Any opinions expressed herein are solely those of the author, and do not in any way represent the views or opinions of any other person or entity.


: Showing Some Signs of Emerging Strength")
