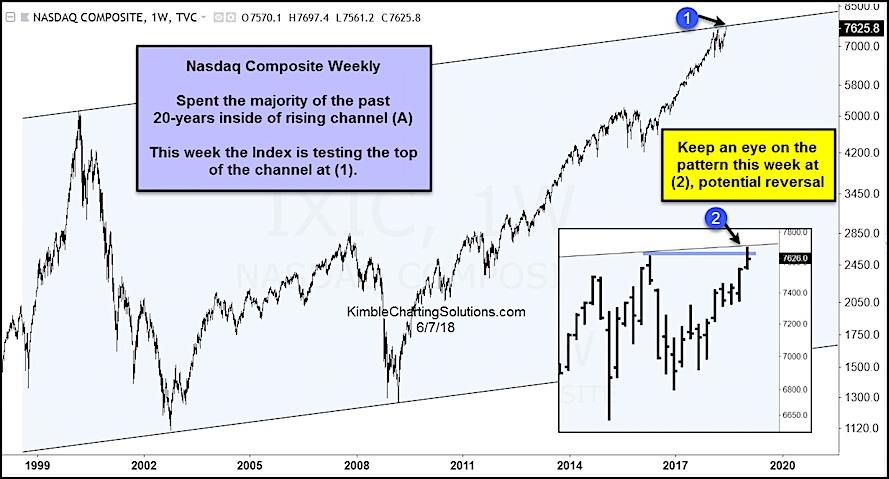
We’ve written several times about the Nasdaq bumping up against major long-term channel resistance.
Well, it touched that level again this week.
The Nasdaq Composite made new all-time highs this week, poking just above the March highs.
But once again, the top of the 20-year channel (1) held as resistance and the Nasdaq turned lower. If tech stocks push lower again on Friday, we could end up with a weekly reversal bar.
Keep an eye on the pattern this week at point (2), as a potential reversal would increase the odds of a short-term stall out and additional selling.
Tech stocks have been a bull market leader, so investors want to pay attention to this week’s close!
Nasdaq Composite Chart
Note that KimbleCharting is offering a 30 day Free trial to See It Market readers. Just send me an email to services@kimblechartingsolutions.com for details to get set up.
Twitter: @KimbleCharting
Any opinions expressed herein are solely those of the author, and do not in any way represent the views or opinions of any other person or entity.


