Facts Instead Of Forecasts
The definition of a fact is a thing that is indisputably the case. The chart below shows the long-term trends in the NASDAQ rolling over in late 2007. The chart presents a set of indisputable facts. Notice in late 2007/early 2008:
- The fastest weekly moving average (blue) crossed below the other moving averages and resided on the bottom of the moving average cluster.
- The slopes of all the moving averages flipped over from bullish (up) to bearish (down).
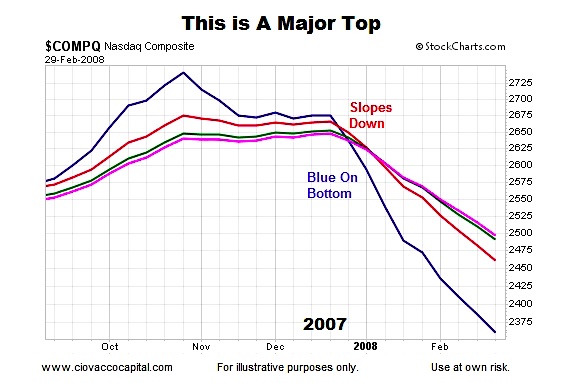
The facts above were observable on January 7, 2008 with the NASDAQ trading at 2,500. After this set of “the trend is rolling over” facts were present for all to see, the NASDAQ dropped from 2,500 to 1,268, a loss of 49%. No predictions or forecasts were needed to observe the evidence on January 7, 2008. The waning look of the NASDAQ’s trend in early 2008 spoke to increasing probabilities of bad things happening.
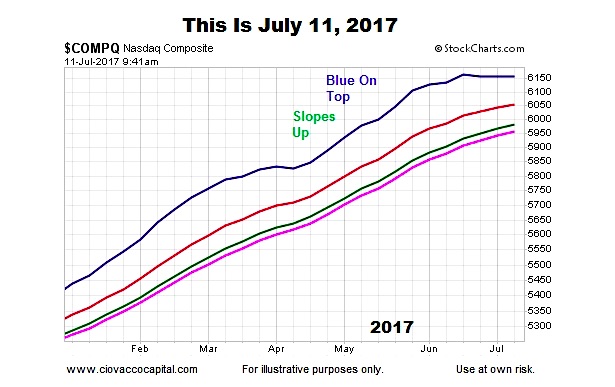
How Does The Same Chart Look Today?
The July 11, 2017 chart below also presents a set of indisputable facts. Instead of the NASDAQ having the concerning “the trend is rolling over” look, the blue moving average remains on top and the slopes of all the moving averages are positive, which is indicative of a bullish trend.
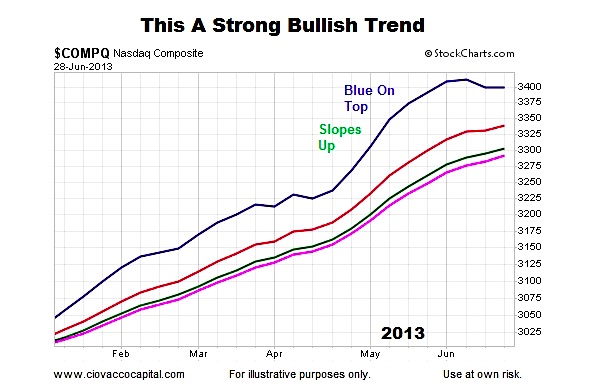
What Does A Healthy Market Look Like?
The chart below shows the same set of facts as of June 28, 2013, when the NASDAQ was trading at 3,403. After we could see the constructive trend on June 28, 2013, the NASDAQ gained an additional 53% before hitting an intermediate-term peak on July 20, 2015.
A Tectonic Shift In Tech
As outlined on June 2, numerous technology stocks have broken out from very long consolidation periods in a “something big could be going on here” manner. A significant shift in the industry’s focus and market potential was highlighted by MarketWatch:
Jefferies equity analyst Mark Lipacis came to that conclusion Monday, reporting in a note that Intel Corp. INTC, +0.10% stands to take a hit in its data-center business amid a move to a new computing paradigm focused on artificial intelligence and connected devices that he believes represents a “tectonic shift” in technology. Instead, Nvidia Corp. NVDA, +0.15% is best-positioned to be the chip leader in the new landscape, Lipacis wrote.
What Are The Facts Telling Us In July 2017?
Given the future is highly uncertain, investment odds can be improved by allocating capital based on facts and adjusting when the facts change. This approach relies on present day facts, rather than uncertain forecasts of what may or may not happen. This week’s video looks at present day facts and compares them to the facts near major bearish turning points. In the present day context of ongoing concerns about North Korea, the Fed, and economy, the video shows numerous examples of the power of staying in the now.
How Can This Help Us in 2017?
Since economic and market outcomes are based on the future actions of millions of consumers and investors around the globe, logic tells us no one can consistently predict where the economy and markets are headed. If the best football handicappers don’t perform much better than a coin flip when trying to predict what will happen when 22 players compete for just 60 minutes, how can we expect someone to accurately forecast the actions of millions of consumers and investors 12 months in advance?
“I learned that an opinion isn’t worth that much. It is more important to listen to the market. I became a reactive trader as opposed to an opinionated trader.”
Brian Gelber
Market Wizards
The present day chart of the NASDAQ is a factual piece of evidence, which is significantly more reliable than a 50-50 forecast of what may or may not happen in the future. The present day trend in the NASDAQ remains constructive from a long-term perspective, which is a factual statement.
If the facts begin to shift, which is possible at any time, then market probabilities will shift as well, allowing us to make necessary and prudent adjustments to our growth-oriented portfolios. Keep in mind, “constructive from a long-term perspective” speaks to months and years. The present day trends allow for normal and 100% to-be expected pullbacks and corrections within the context of a long-term bullish trend.
Get more investing research from Chris on his CCM website.
Twitter: @CiovaccoCapital
The author or his clients may hold positions in mentioned securities at the time of publication. Any opinions expressed herein are solely those of the author, and do not in any way represent the views or opinions of any other person or entity.


