The panic associated with the recent carnage in tech stocks and the Nasdaq 100 (INDEXNASDAQ:NDX) has begun to subside; but is it too soon to exhale?
It is apparently tech week here in our blogs – and every other Financial news media site, as well – as the coverage is all tech wreck all the time (a phrase, by the way, which we started using before we saw it anywhere else).
I suppose it is not surprising, however, given the recent action in technology stocks. Along with others, we will tend to gravitate to where the action is (though, we do prefer to arrive before the crowd!). In this case, we continue to monitor the aftermath of the tech wreck in search of clues as to where the market may be headed next.
Yesterday, we covered the unusual circumstances whereby the breadth on the NASDAQ exchange was actually positive last Friday, even as the NASDAQ Composite was getting drubbed. The NASDAQ’s path, i.e., higher or lower, following similar historical precedents seemed to depend upon a specific characteristic of the index at the time (which we shared with members of our “all-access” site, The Lyons Share).
Today’s post, and Chart Of The Day, deals with the volatility component of the recent action in tech. Following a historic jump in the NASDAQ 100 volatility index (INDEXCBOE:VXN) on Friday, and to begin the day on Monday, the Nasdaq 100 Volatility Index (VXN) actually closed substantially lower by the end of the day on Monday. As stock volatility indices typically move in the opposite direction as their underlying stock index, the drop was unusual considering the sizable decline in the NDX on Monday.
Specifically, the NDX was down 0.6% while the VXN lost more than 6%. This was just the 16th time since the inception of the VXN in 2001 that the NDX dropped more than 0.5% and the VXN lost more than 5% on the same day.
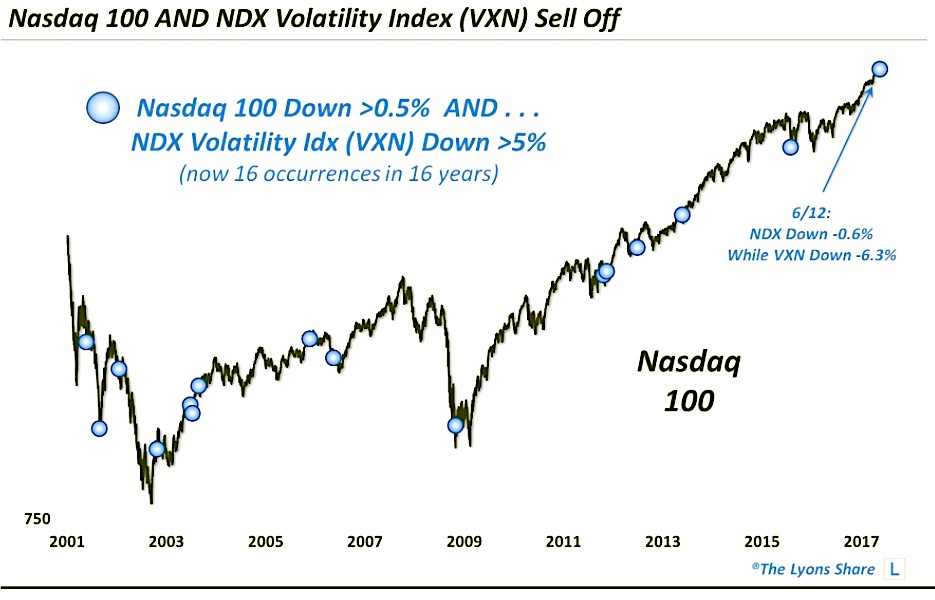
So how do these prior occurrences instruct us regarding our present circumstances? Well, as the chart shows, several – but not all – of the occurrences took place near market lows of some magnitude. Thus, in aggregate, the performance of the NASDAQ following these events had a definite positive bias – in particular, in the intermediate-term
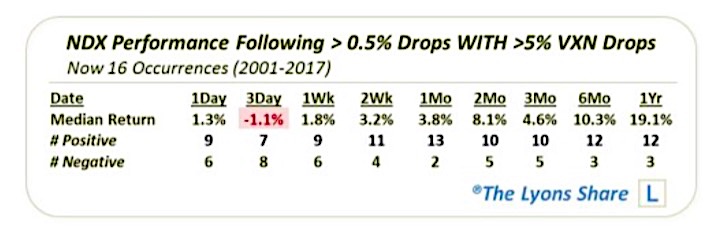
Just 2 of the incidents saw losses in the NDX a month later. By 2 months, the median return was an impressive +8.1% and longer-term returns were exceedingly positive as well.
However…
There were a couple of notable failures in the intermediate to longer-term. Fortunately, like Monday’s post, we were able to identify one characteristic of the market that filtered out the egregiously negative occurrences in the intermediate to longer-term. In a premium post at The Lyons Share, we detailed to our members what that characteristic is – and on which side of the coin our current incident falls. If you are interested in an “all-access” version of my charts and research, check it out.
Thanks for reading.
Twitter: @JLyonsFundMgmt
The author may have a position in mentioned securities at the time of publication. Any opinions expressed herein are solely those of the author, and do not in any way represent the views or opinions of any other person or entity.


