In, The Lowest Common Denominator, we quantified the extent to which growth of consumer, corporate, and government debt has greatly outstripped economic growth and our collective income.
This dynamic has made the servicing of the debt and the ultimate pay back increasingly more reliant on more debt issuance.
Fortunately, taking on more debt for spending/consumption and to service older debt has not been a problem. Over the past twenty years there have been willing lenders (savers) to fund this scheme, even as their reward, measured in yield, steadily declined.
Unfortunately, two of the largest buyers/holders of U.S. Treasury debt (China and the Federal Reserve) are no longer pulling their weight. More concerning, this is occurring as the amount of Treasury debt required to fund government spending is growing rapidly. The consequences of this drastic change in the supply and demand picture for U.S. Treasury debt are largely being ignored.
Foreign Bond Holders
In our article, Triffin Warned Us, we provided a bit of history on the Bretton Woods Agreement. This pact from 1944 essentially deemed the U.S. dollar the world’s reserve currency. As a result of the agreement, foreign nations rely heavily on U.S. dollars for all types of international trade. For instance, if Uruguay sells widgets to Australia, Australia will most likely pay Uruguay in U.S. dollars. Because of the reliance on dollars for trade, Uruguay, Australia and almost every other nation holds reserves of dollars.
Foreign entities with dollar reserves maximize the interest they earn on reserve accounts with the objective of taking as little risk as feasible. Think of reserve accounts as savings accounts. As such, foreign reserves are most often invested in “safe” U.S. Treasuries. As world trade has grown over the years, the need for dollar savings has grown in step and has resulted in more lending to the U.S. Treasury by foreign governments.
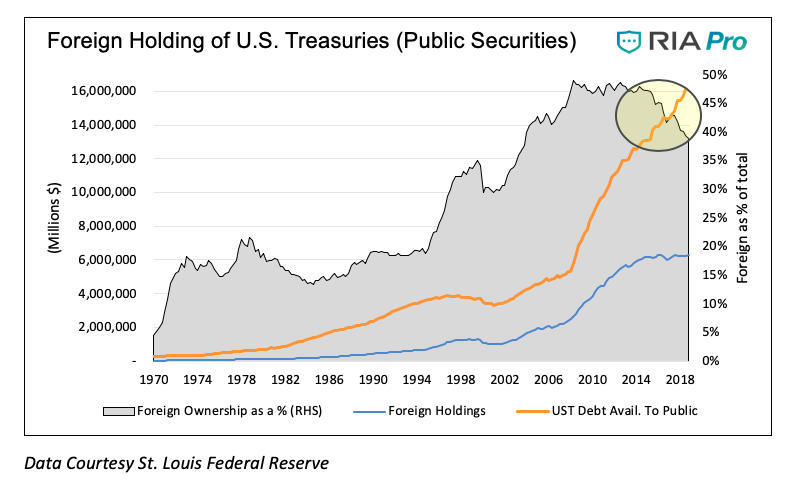
Recently the incremental appetite from foreign buyers, both private investors and governments, has declined. Prior to the last two years, the last instance with flat to negative growth over a two-year period was 1999-2000. During that period, the amount of U.S. Treasury debt outstanding was shrinking, and despite a decline in foreign ownership, foreign ownership as a percentage of bonds outstanding rose.
The graph below charts the amount and percentage of foreign holdings of public U.S. Treasury debt outstanding (excluding intra-governmental holdings such as social security administration investments), and total public debt outstanding. As highlighted, the divergence occurring over the past few years is without comparison in the last forty years. As a point of reference, the last time foreign entities meaningfully reduced their holdings (1979-1983) the ratio of U.S. Treasury debt to GDP was less than 40% (currently 105%). Needless to say, the implications of a buyers strike today are quite different.
Federal Reserve QE
During the financial crisis and its aftermath, government spending and debt issuance increased sharply. From 2008 through 2012, Treasury debt outstanding increased by over $8 trillion. This was three times as much as the $2.6 trillion increase during the five years preceding the crisis.
Faced with restoring economic growth and stabilizing financial markets during the crisis, the Federal Reserve took the unprecedented step of lowering the target for the Fed Funds rate to a range of 0-0.25%. When this proved insufficient to meet their objectives, they introduced Quantitative Easing (QE).
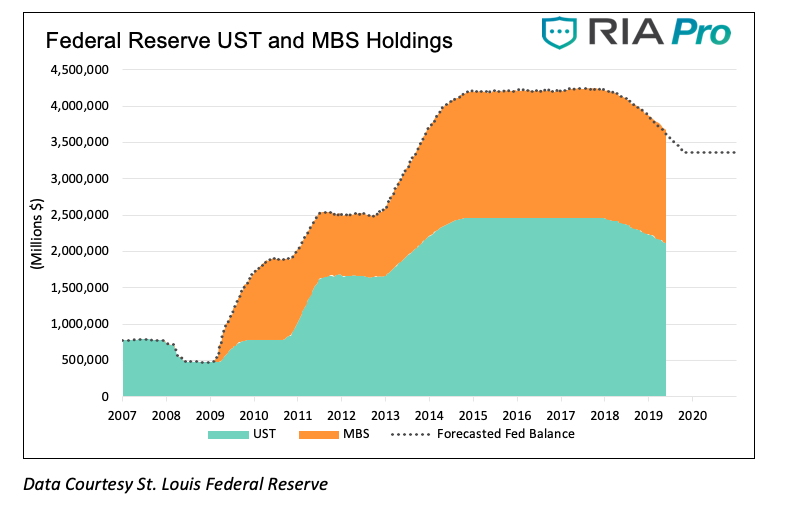
The implementation of QE had the Fed purchase U.S. Treasury securities and mortgage-backed securities (MBS) in open market operations. By reducing the amount of bonds held publicly they reduced Treasury and MBS yields which had the knock-on effect of lowered yields across a wide spectrum fixed-income securities. After three rounds of QE, the Fed had purchased over $1.9 trillion Treasuries and over $1.7 trillion MBS. At its peak, the Fed owned 19% of all publicly traded U.S. Treasury securities.
In October 2017, the Fed began balance sheet normalization, the process by which they reduce their holdings of U.S. Treasuries and MBS, in what is colloquially known as Quantitative Tightening (QT).
Since then, they have reduced their Treasury holdings by over $200 billion. Although they have been shedding $50 billion a month between U.S. Treasuries and MBS, they intend to reduce and halt all reductions by the end of September. The following graph shows the size of the Fed’s balance sheet as well as its expected decline.
What’s happening to Federal Reserve and Foreign holdings of UST’s?
continue reading on the next page…


