The resistance and support levels we posted in early September for Microsoft (NASDAQ: MSFT) worked extremely well to catch the boundaries of an expected Elliott wave retracement. After MSFT price broke out of its earlier range, it moved impulsively upward toward some completion targets.
It’s possible the stock can eke out a minor new high during the next few weeks, but bears will gain confidence if Microsoft’s stock price remains trapped beneath resistance at 344.99.
As we trace the progression of the Elliott wave count, one of our anchors has been the scary March 2020 stumble in price. The dip had many characteristics of an Elliott fourth wave, and we are treating the action since that time as a probable fifth and final upward segment.
One of the factors making it difficult to forecast the end of this move has been the fact that the fifth waves in the pattern keep extending. Upward wave (v) has reached much farther than the previous wave (iii), and it has printed five distinct sub-waves. Moreover, the final sub-wave ‘v’ itself has extended to form five additional sub-waves of smaller denomination.
In the weeks since October 4, the expected small and final wave [V] has itself extended as an impulse. This can be counted more easily on a daily chart and is not delineated here.
The question for MSFT bulls now is whether the consolidation during the past three weeks is a fourth wave of some degree. It is starting to look outsized compared to the more brief correction – possibly a second wave – during the week of October 25. A break and weekly close beneath 319.18 would serve as initial confirmation that the upward pattern is complete and the high is in.
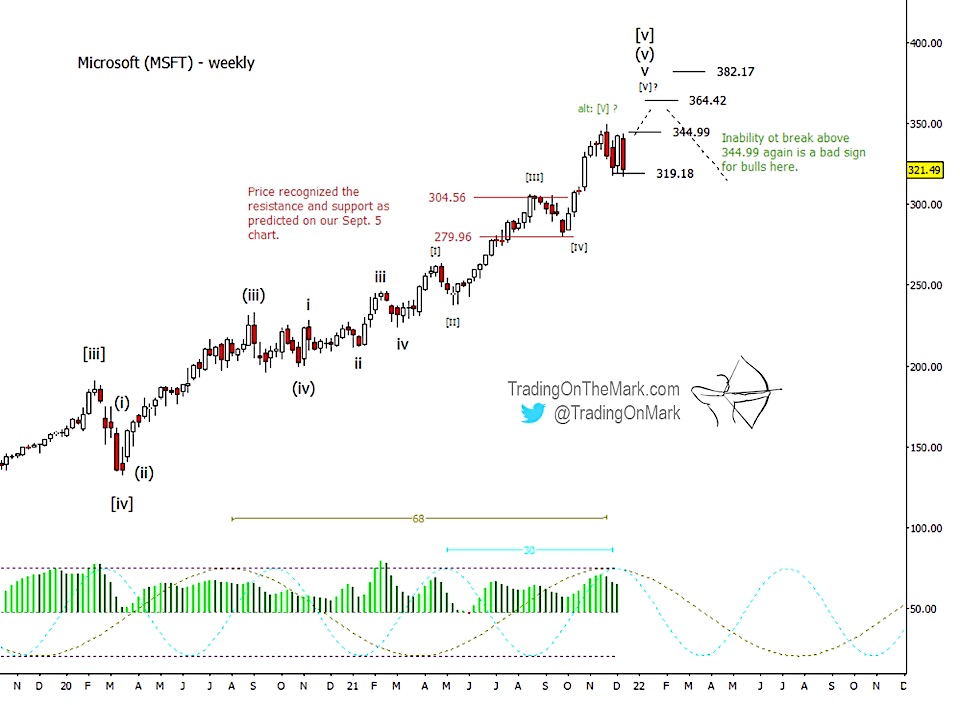
Note there’s a confluence of projected highs around now for the 20-week and 68-week cycles, suggesting the current upward trend should run into some turbulence if not a reversal.
A break and weekly close above 344.99 would open the door for near-term bulls to test the next resistance area near 364.42. There’s also a “stretch” target at 382.17.
On a larger scale, it’s possible to count five waves up on a monthly chart (not shown here) from the 2009 low. Based on that, we expect the current upward move to be the precursor to a major reversal. Our expectation doesn’t mean MSFT will necessarily crash in 2022-2023, but we expect the market to shift into a mode that treats the current price area near 350 as the upper edge of a long-term range.
You can get daily charts and updates for this and other highly traded markets via our subscription page on Substackand on Twitter. Take advantage of our holiday price special and save 20% on any type of subscription.


