Our expectation for Microsoft shares (NASDAQ:MSFT) is similar to what we described at the beginning of the summer for the broader NASDAQ index – specifically that it is working on forming its penultimate high in the climb from March 2020.
An autumn correction should lead to a final attempt to rally into early 2022, which should precede a substantially larger correction.
MSFT stock charts particularly well with Fibonacci measurement techniques, so we’re using those along with traditional Elliott wave analysis to point out some resistance and support levels to watch for the next swings. In particular we’re watching the development of an impulsive move up from the March 2020 low.
Within the (i)-(ii)-(iii)-(iv)-(v) impulsive structure, wave (v) for Microsoft’s stock appears to be extending. Furthermore, within wave (v), the final sub-wave ‘v’ also appears to be extending. Thus we may also be watching the development of upward impulsive structures that are one and two orders of magnitude smaller than wave (v).
Despite the nested extending patterns, price has met an important resistance level at 304.56 that could produce a relatively small wave [iv] correction soon, which could represent a correction of about 5% to 8%. Based on Fibonacci relationships among the waves and sub-waves, we are first watching support at 298.87. A break and weekly close beneath that level would serve as practical confirmation that the expected wave [iv] correction has begun.
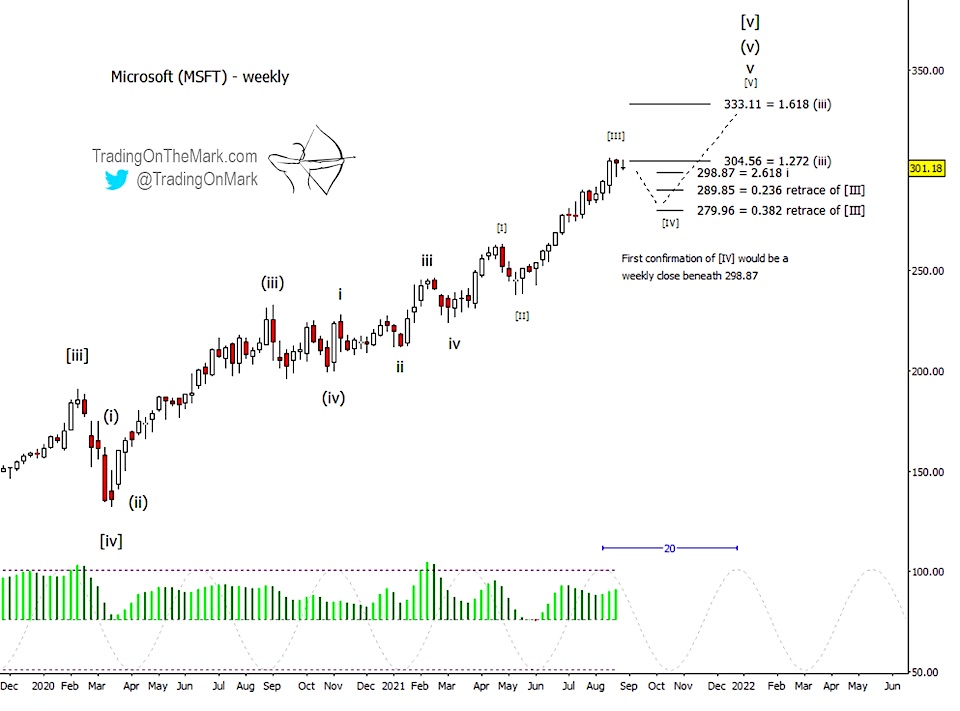
If the correction gets started soon, we’ll watch supports at 289.85 and 279.96 to provide a floor and a basis for the next bounce, which could become the final attempt at a new high during the next few years. Provisionally we have marked the bigger-picture resistance at 333.11 as a likely target for the next high, and we might see MSFT reach that area late in 2021 or early in 2022. The 20-week cycle has an ideal crest near the turn of the year.
Trading On The Mark provides detailed, nuanced analysis for a wide range of markets including crude oil, the S&P 500, currencies, gold, and treasuries. Sign up for free market updates via our page on Substack and follow us on Twitter for more charts.
Twitter: @TradingOnMark
The authors may have a position in the mentioned securities at the time of publication. Any opinions expressed herein are solely those of the author, and do not in any way represent the views or opinions of any other person or entity.


