May corn futures closed up a penny per bushel last Thursday. That marked the first higher close of the week last week.
That’s how it has been lately for corn bulls. Today we will mine through all the latest data to answer a simple question:
How Worried Should Corn Bulls Be?
All week I’ve been inundated by grain wire after grain wire almost universally defending the current downtrend in corn futures while also simultaneously dismissing the significance of Money Managers continuing to add to an already record net short corn position (est. at -380K) even with May corn futures now trading at new contract lows.
Apparently corn will never rally again. The farmer is long old-crop corn in the bin, planting delays don’t matter, the U.S. is guaranteed to have another record to near-record corn yield exceeding 176 bpa in 2019/20 with ending stocks destined for 2.3 to 2.4 billion bushels. This is when insanity prevails and bandwagon market analysis becomes contagious. Here’s my latest attempt at adding just a pinch of objectivity to the discussion:
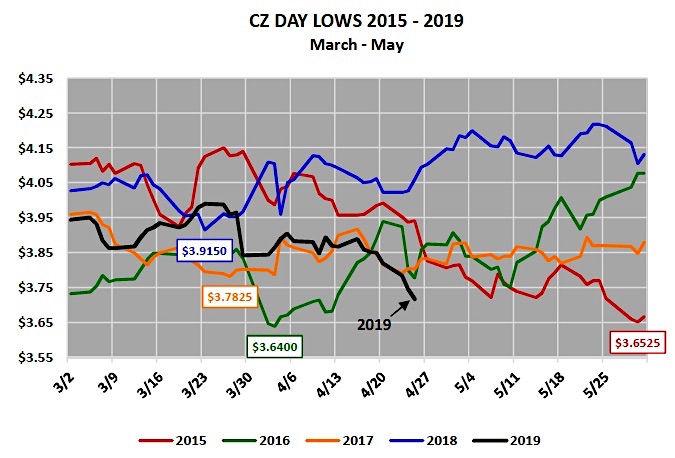
Note the seasonal December corn futures day lows during the months of March, April, or May the last 4-years versus the current CZ low for 2019:
- 2015: $3.65 ¼ on May 28th, 2015
- 2016: $3.64 on April 1st, 2016
- 2017: $3.78 ¼ on March 27th, 2017
- 2018: $3.91 ½ on March 23rd, 2018
- 2019: $3.71 ¾ on April 25th, 2019
CORN CHART WITH ‘DAY LOWS’
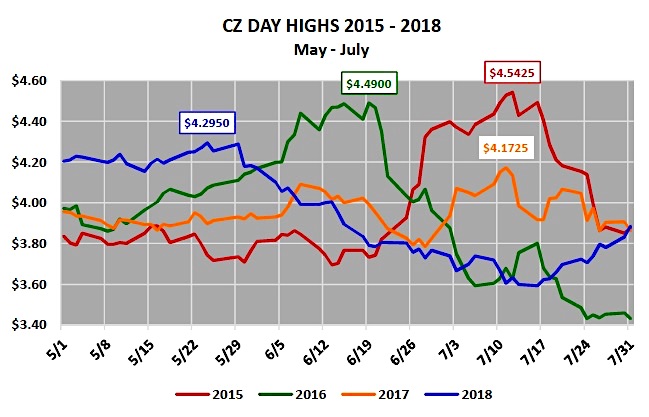
Now conversely note the seasonal December corn futures day highs during the months of May, June, or July the last 4-years (chart on page 2):
- 2015: $4.54 ¼ on July 14th, 2015
- 2016: $4.49 on June 17th, 2016
- 2017: $4.17 ¼ on July 11th, 2017
- 2018: $4.29 ½ on May 24th, 2018
CORN CHART WITH ‘DAY HIGHS
That said, should we really be “throwing in the towel” on corn rallies back to or above at least$4.00 per bushel for the remainder of the 2019 growing season due to a sell-off during the month of April in December corn futures below $3.75? Short answer: No. The reality is none of what’s happening currently in CZ19 should be considered atypical relative to the last 4-years.
Keep in mind the following as well:
- In 2015 the final U.S. corn yield was 168.4 bpa versus ending stocks of 1.737 billion bushels
- In 2016 the final U.S. corn yield was 174.6 bpa (record at that time) versus ending stocks of 2.293 billion bushels
- In 2017 the final U.S. corn yield was 176.6 bpa (current record) versus ending stocks of 2.140 billion bushels
- In 2018 the final U.S. corn yield was 176.4 bpa (2ndbest ever) versus ending stocks of 2.035 billion bushels.
Point being at no time in any of those years was there ever a very real concern about the U.S. experiencing a sharply below-trend final U.S. corn yield and/or U.S. corn ending stocks that required sustained price rationing. In fact in 2016, 2017, 2018…it was just the opposite, record to near-record U.S. corn yields with 2.0 billion bushel ending stocks estimates for 3-consecutive crop years.
And yet CZ still managed to climb back over $4.00 per bushel at some point during May, June, or July in each of those years.
That said I for one am going to tap the brakes on the notion that corn futures are heading for $0 per bushel and that corn will never rally again.
Could it take a while for a rally to materialize? Absolutely…in 2017 due to massive carryin stocks (2.293 billion bushels) and 90+ million corn acres CZ was still trading in the mid-$3.80’s as late as the last two trading days of May. That said I’m not expecting some imminent trend change in price in the next two to three weeks; however I do believe over time selling opportunities at substantially better values will present themselves.
OTHER HIGHLIGHTS:
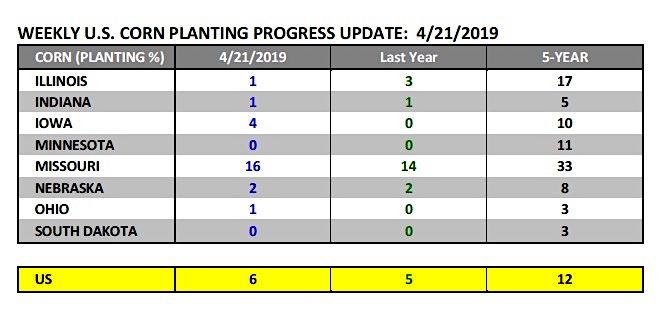
Monday’s Weekly Crop Progress report showed U.S. corn planting at 6% complete for the week ending April 21st, 2019. This was 1% ahead of a year ago but below the 5-year average of 12%.
Illinois, Minnesota, and Missouri stood out for being well behind their 5-year averages with IL just 1% planted versus its 5-year average of 17%, MN 0% planted versus 11%, and Missouri 16% planted versus 33%. The market believes however that the Midwest in general, and specifically sections of southern and central Iowa, will make some very good planting progress this week. This neutralized any potential positive market impact on Tuesday morning.
Wednesday’s EIA report showed weekly U.S. ethanol production jumping back up to an impressive 1.048 million barrels per day for the week ending 4/19/2019 (2ndhighest weekly run-rate for 2019). Ethanol stocks were steady week-on-week at 22.7 million barrels.
The increase in ethanol production was a welcomed surprise for Corn Bulls, following a 50 million bushel reduction to 2018/19 U.S. corn ethanol demand in the April 2019 WASDE report. Industry average ethanol margins have now turned cash positive EBITDA for both June and July, which is important as far as maintaining a higher weekly run-rate.
On Thursday May corn continued its aggressive slide lower, establishing a new contract low of $3.42 ¼ early in the session.
However by mid-session corn had fought its way back to green figures, which served as possibly the first sign in weeks that Money Managers had finally pushed corn futures to levels that no longer justified them continuing to add to an already record net short position (estimated at close to -380k contracts through Thursday’s closes; see page 4).
MAY CORN FUTURES TRADING OUTLOOK
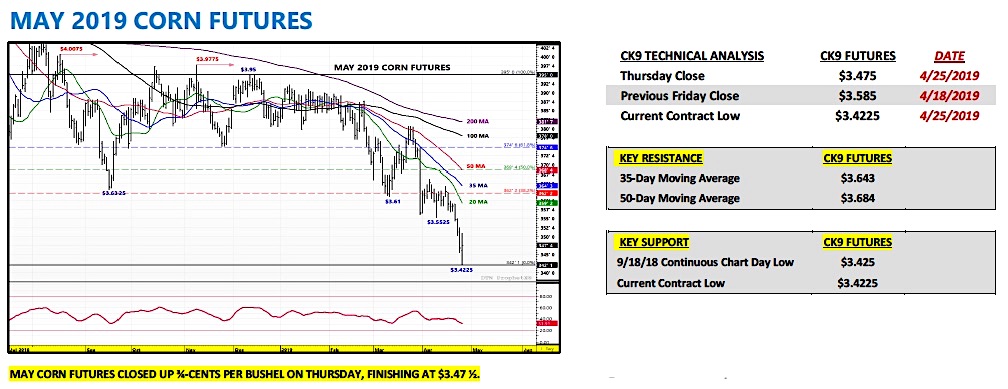
Also of note, technically speaking corn futures have now reached oversold price conditions with the RSI closing under 32.0 on Thursday afternoon in May corn futures. A reading close to or below 30.0 is an indicator of a market where the probability of a positive price reversal increases dramatically.
There were some demand positives this week including: Weekly U.S. corn export sales totaled a respectable 30.7 million bushels for the week ending 4/18/2019.
Crop year-to-date sales improved to 1.790 billion bushels, and although the export sales pace continues to run approximately 8.5% behind a year ago, actual U.S. corn shipments are well ahead of the pace needed to achieve the USDA’s revised marketing year export forecast of 2.300 billion bushels. In fact U.S. corn export inspections are running almost 12% ahead last year (2017/18), which featured marketing year exports of 2.438 billion bushels. Therefore the export market isn’t all negatives, which seems to be the impression most grain wires have offered over the last 4 to 5 weeks. That simply isn’t true.
And finally rain has been added to the forecast for next week, specifically for the ECB.
I’m not changing my long-term price bias in corn. If you’re looking for a non-original market opinion there’s plenty to choose from at the moment. From where I sit this market has gotten way ahead of itself…
Twitter: @MarcusLudtke
Author hedges corn futures and may have a position at the time of publication. Any opinions expressed herein are solely those of the author, and do not in any way represent the views or opinions of any other person or entity.
Data References:
- USDA United States Department of Ag
- EIA Energy Information Association
- NASS National Agricultural Statistics Service

: Worrisome to Broader Market?")

