It’s been a while since I posted a market update using DeMark analysis. And since the stock market has been red-hot since the February lows, there’s probably no better time than now.
Feel free to read my primer on the basics of DeMark indicators. Below I run through several markets and provide a broad overview of where they are at based on DeMark Indicators. In this update, I look at Crude Oil, the S&P 500, the Long Bond, Gold, and Investment Grade (IG) Credit Derivatives.
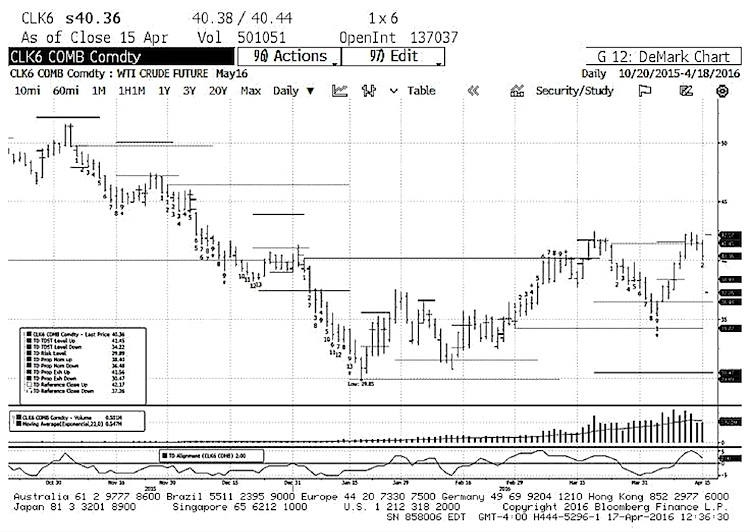
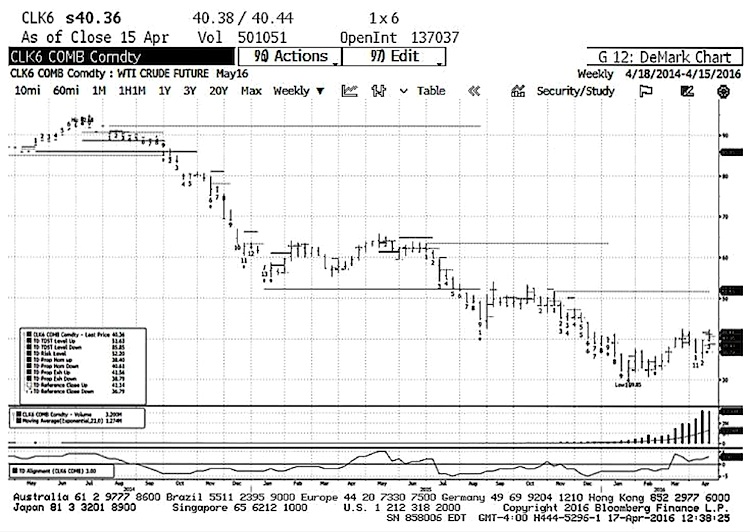
Crude Oil (CLA)
Friday’s close cancelled the daily TD Sell Setup right as it was hitting against TDST Level Up. The weekly counts still have an unfinished Buy Countdown to deal with. The completed TD Sell Setup and qualified break of TDST Level Up that printed in mid-March signaled that the October-to-January rout was over, but the subsequent early-April Perfected Buy Setup, and Friday’s cancellation of the Sell Setup reinforce my sense that, while a good low may be in, buying energy remains tepid at best. Daily and weekly charts below.
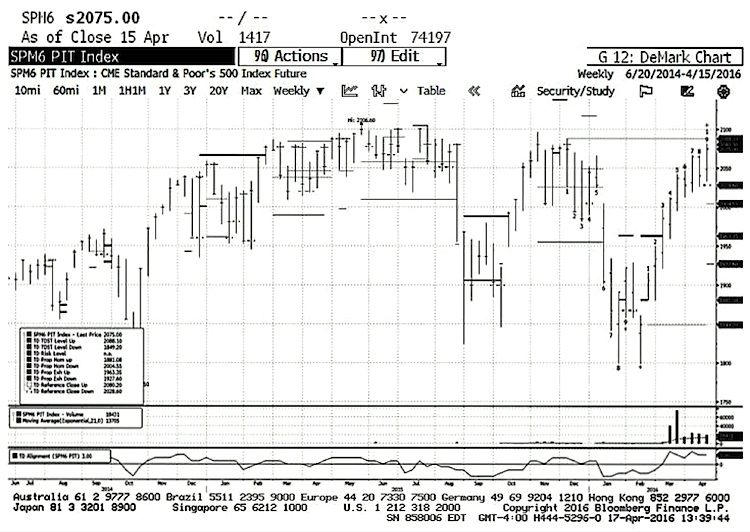
S&P 500 Pit Traded Futures (SPA)
On Friday the Weekly chart (below) completed a Perfected Sell Setup just below TDST Level Up. The Daily chart just completed a Sell Countdown above TDST Level Up. The “Risk Level” (a/k/a secondary exhaustion) associated with the daily Sell Countdown is at 2097.80. The daily count is now on Bar 3 of a new Sell Setup count. Looking at the daily and weekly charts together, everything suggests a pause / pullback over the next few weeks, with the odds in favor of another leg higher thereafter.
U.S. Long Bond Futures (US1)
NOTHING on a daily or weekly basis to entice me to short the long bond. A purely DeMark technical argument could be made that there’s unfinished business to the upside, but if one has been long so far, hanging around for more or initiating new positions, that approach seems rather “greedy. (No charts)
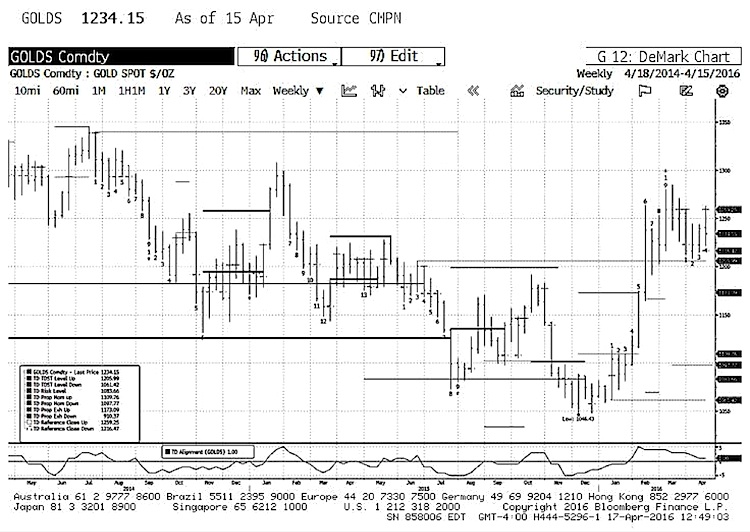
Gold (GOLDS)
On a weekly basis gold is pulling back off a completed Sell Setup above TDST Level Up; however, the TDST Level Up break remains un-qualified. The count is currently on Bar 4 of a Buy Setup. If the current Buy Setup cancels and the break of the TDST Level Up is qualified, it should clear the way for another leg higher.
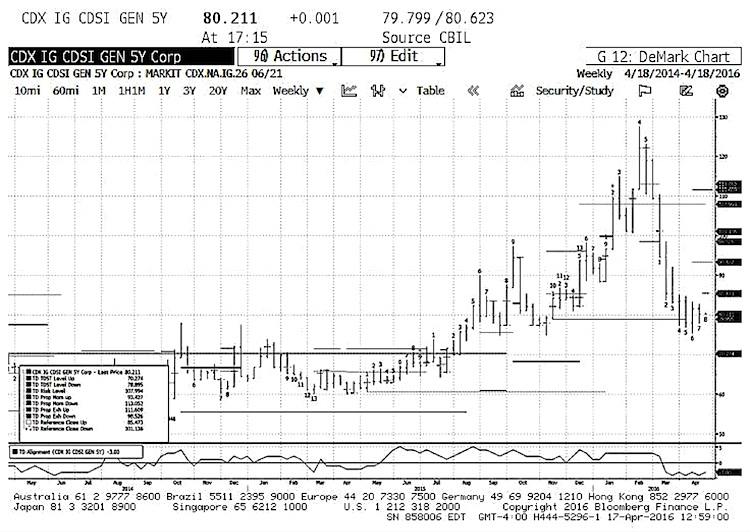
IG CDX Index
The weekly chart needs a close below 78.06 this coming Friday to complete a Buy Setup below TDST Level Down; that TDST Level Down has already been broken on a qualified basis. IF the Buy Setup completes on Friday, credit bears buying this derivative to get short the corporate credit market will be swimming against a tidal wave and, conversely, it would put the credit underpinning of equities on even stronger footing. That said, based on the daily chart, my guess is that the Sell Setup does not complete this Friday, making the chart more neutral. In other words, don’t “anticipate” what’s going to happen.
Good luck and good trading!
More from Fil Zucchi: “Corporate Credit Markets Set For Extended… Period Of Balance?“
Twitter: @FZucchi
The author has a position in SPA (S&P 500 pit futures) at the time of publication. Any opinions expressed herein are solely those of the author, and do not in any way represent the views or opinions of any other person or entity.


