Note that this post went out to my “Gone Fishing” newsletter subscribers at year end. You can subscribe here.
Reflections and Inflections
That’s a wrap! The S&P 500 (SPY) finished 2017 up 19.6% and the NASDAQ gained an impressive 28.4%! The NASDAQ rose for the 6th straight year – which last happened from 1975 to 1980. The SPY earned the distinction of not having one red month all year – which has never happened.
Suffice it to say, it’s more than impressive to see stocks have their best risk-adjusted return year since 1926 (thanks VIX sellers) while valuations are 2.5 standard deviations above their historic mean (thanks momentum buyers) and all against the backdrop of the Fed tightening (balance sheet and rates) and Trump stoking political unrest (both home and abroad). What a year!!!
So now what? Trump signed the Tax Reform Bill in late December and is likely to pivot attention on infrastructure spending come January. Bulls are expecting a shift from monetary to fiscal support which incentivizes entrepreneurial risk-taking to drive economic growth. Bears are anticipating a “buy the rumor, sell the news” market pullback. The VIX is so far below its mean that we need a 5% correction in stocks to push it back up to is mean near 20. What are the chances?
There is nearly $17 invested in leveraged long funds for every $1 in leveraged short funds. The other 2 times we saw spikes like this, the “500” dropped by more than 5%, although the declines were temporary. – Jason Goepfert @ www.sentimentrader.com
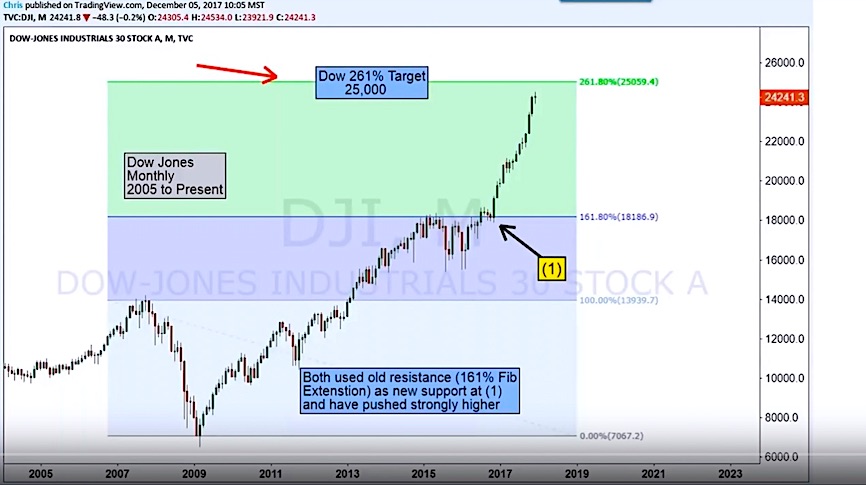
And this could happen if the market decides it has priced in the margin expansion and GDP growth impact from Tax Reform. If not, it likely grinds higher. Here is my response to a twitter follower the other day. This is a ‘conventional’ SPX price target by the way – now that my $2672 price target from February 2017 was hit this December:
This is ‘swag’ but … SPY EPS grew 10% in 2017 + is expected to grow same in 2018, before corp tax rate cut from 35 to 21% = 14% or $14 added to forecasted 2018 SPY EPS: $144 + $14 = $158 which is 17x earnings but in low-rate environment stock valuations can run 20x so $3160…
The question many analysts have is will repatriation of US dollars feed the expected stock buybacks and further juice asset prices or go toward paying off large amounts of corporate debt accumulated during this ultra-low-rate environment which happened to be used to feed stock buybacks and juice asset prices. Either way, analysts keep raising their targets.
ALSO READ: Happy New Year… Trades & Market Calls
Inflation Watch
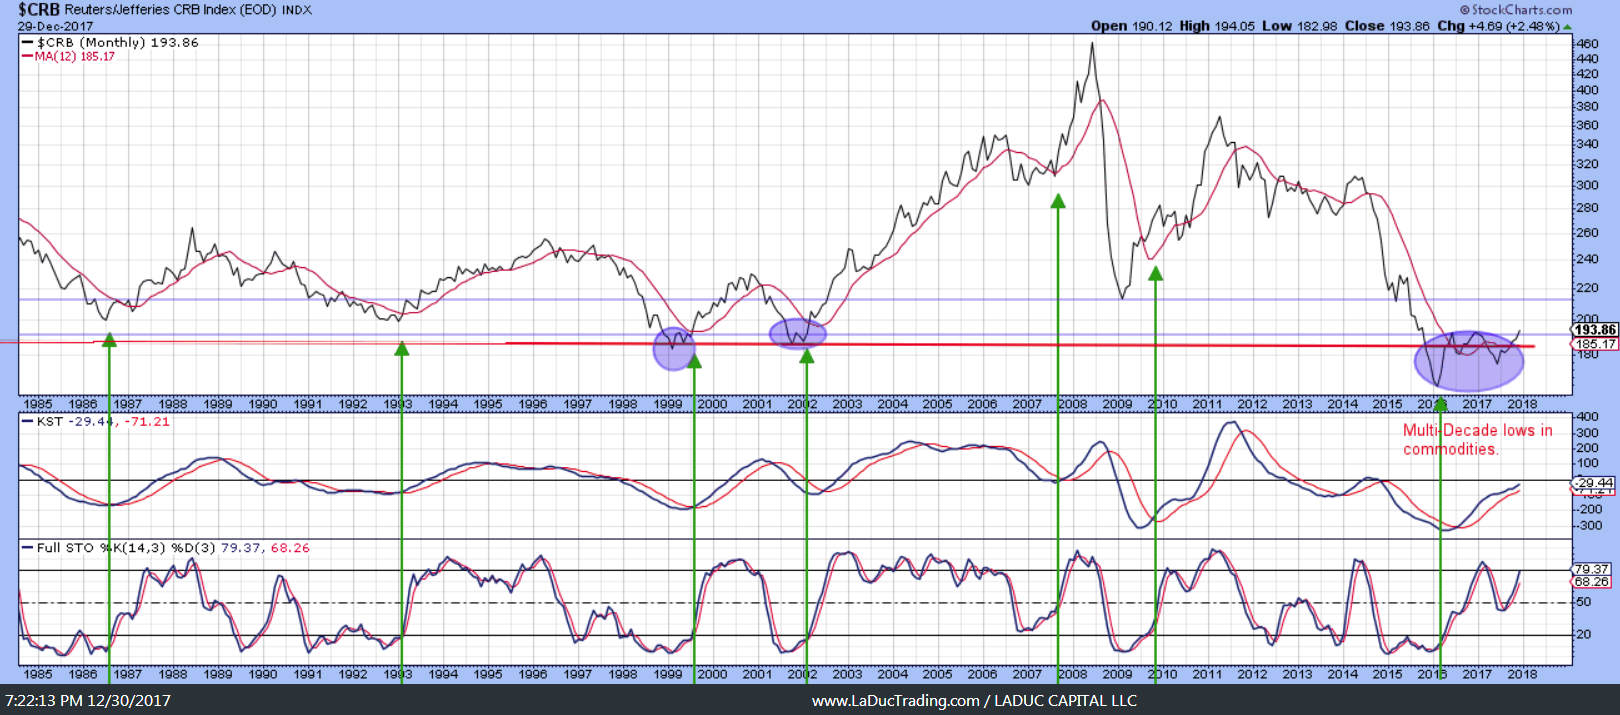
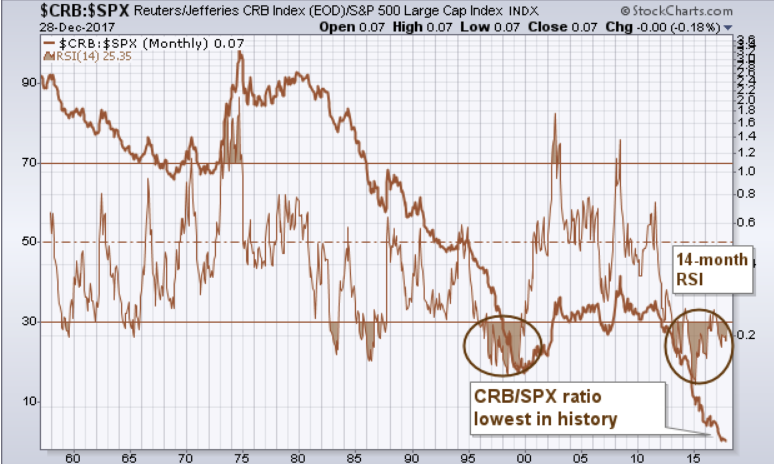
Inflation – both good and bad kinds – are under close watch. Commodity prices typically do better in the later stages of a business cycle as inflation pressures start to build. Inflation proxies like oil, copper, aluminum and steel have traded much higher in Q4 which is helping the CRB index form a nice bottoming pattern. Mining stocks like FCX, BHP, RIO, VALE, and GLNCY have been the biggest beneficiaries of money flowing into commodities. But is this theme setting up for a major trend reversal or disappointment which will cue the deflation hawks? Investors eagerly await confirmation the turn in commodity assets is here as value shoppers know they are at their cheapest relative to stocks in decades, with 2016 lows not seen in more than half a century.
Nice reminder from John Murphy:
And then there is my friendly reminder that with inflation spikes, in a Fed tightening cycle no less, money can rotate – rather quickly – out of prior leaders (think FAANNMG: FB, AMZN, AAPL, NFLX, NVDA, MSFT, GOOGL…) and into this oversold asset class of commodities. And spiking commodities can spike yields, which puts even more pressure on Tech leaders to grow themselves out from underneath rising debt financing pressures.
For all their share price gains, the multiples on the FANG stocks haven’t gone up – instead, earnings and revenue growth have been fairly consistent for years now. @ReformedBroker
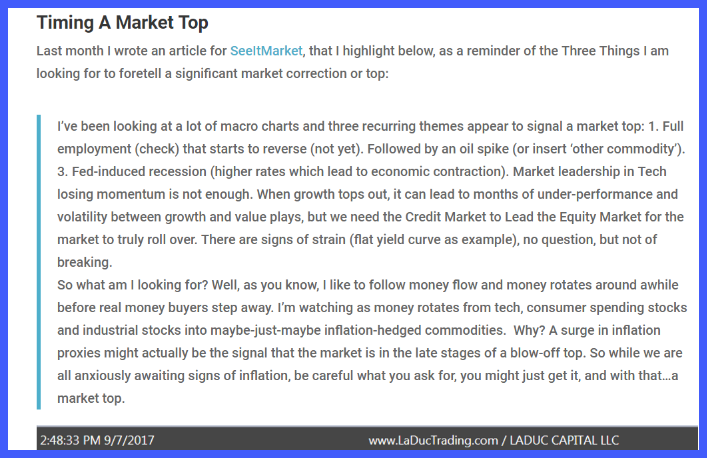
Point is, “Outliers Revert With Velocity” as I like to say. A little mean-reversion trade is forming: overbought tech/indices for oversold commodities as a theme for 2018. But this little mean-reversion can imply a Market Top. In August 2017 I wrote we may have to wait until Dec for “a surge in inflation proxies.” I think we got that given JJC, SLX, WTIC are trading in some cases 50% higher.
What About the Yield Curve
The yield curve, and everyone’s fascination with how flat it has gotten, reflects the initial tightening in the system against perceived stronger economic conditions.
Bloomberg’s Matthew Boesler has observed that the two-to-five year and five-to-10 year portions of the Eurodollar curve are already as flat as they were when the spread between two- and 10-year Treasury yields went negative in 2006. It took a flip towards rate-cut expectations in 2006 to invert the curve, suggesting that current market expectations for rate increases over the next two years are the only thing keeping the curve from completely inverting.
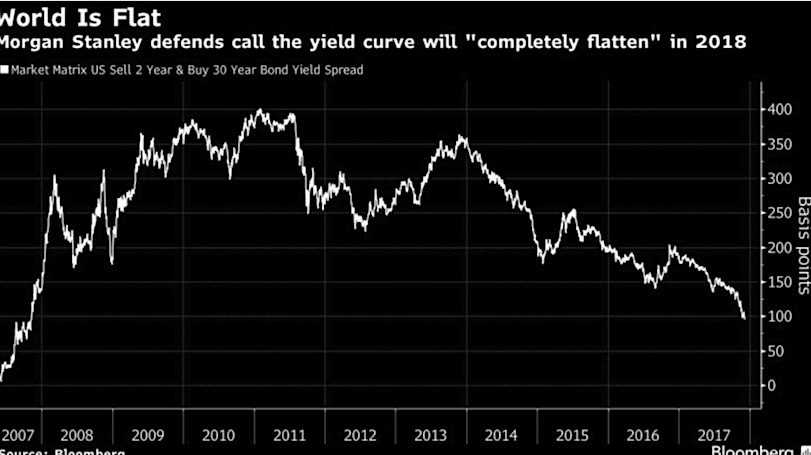
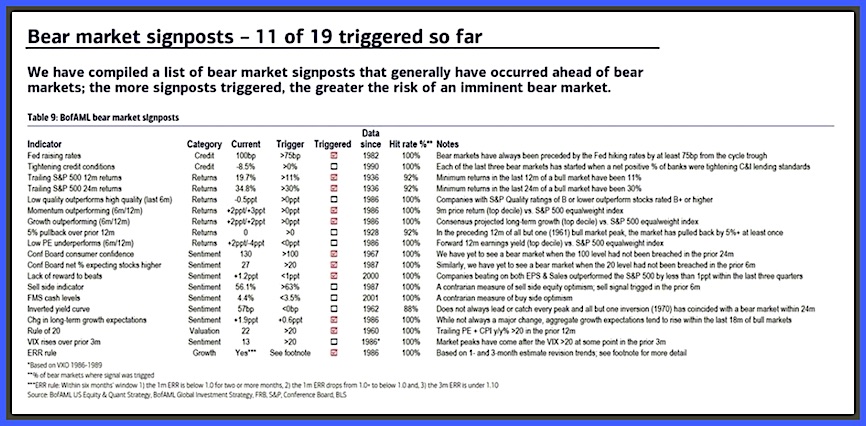
Yield curve flattening is currently not one of the triggered bear market signposts – not yet anyway.
So the Most Important Chart in the World…presented by 13D without comment:
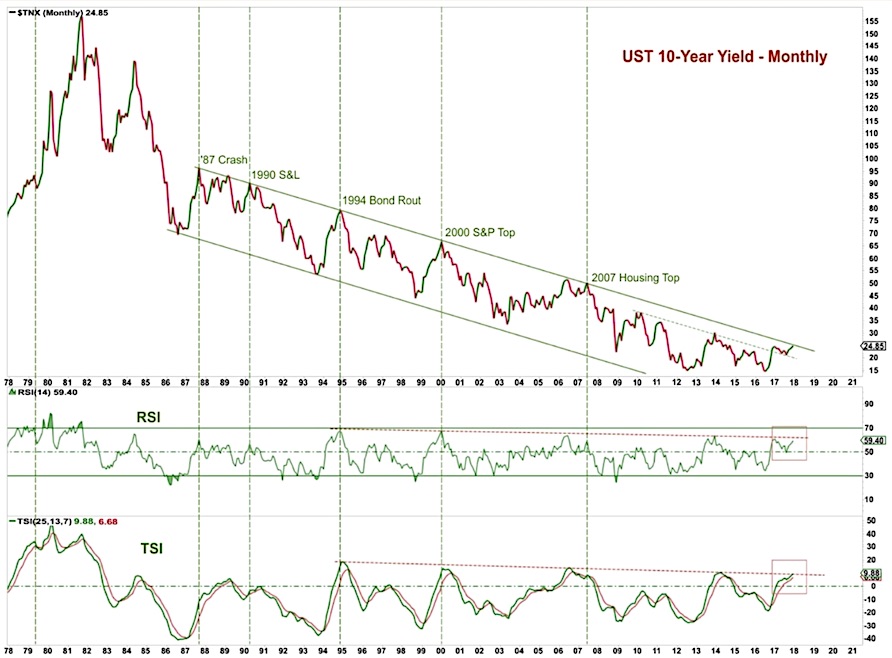
I believe, the bond market is not buying this tax plan or frothy market valuations as good enough to avoid inversion. If they did TLT and IEF would have collapsed by now. They haven’t. As QE reverses, and liquidity tightens, we have the risk of the perfect storm occurring: orchestrated Fed rate hike/rebalancing with extreme USD shortage/repatriation and Tax Bill deficit expansion/potential credit downgrade, all of which are likely to reverse the ultra-low volatility regime set in play on Trump’s election night.
Perspective
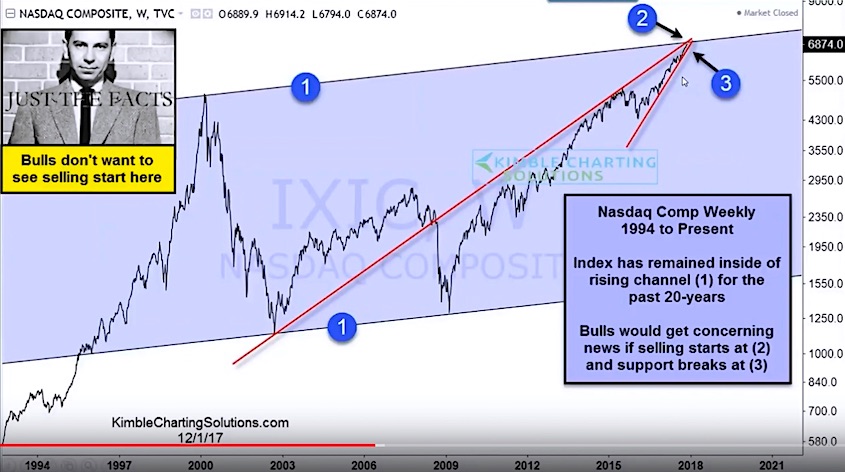
Charts of Interest I grabbed from fellow traders foretell a pause and fall as well:
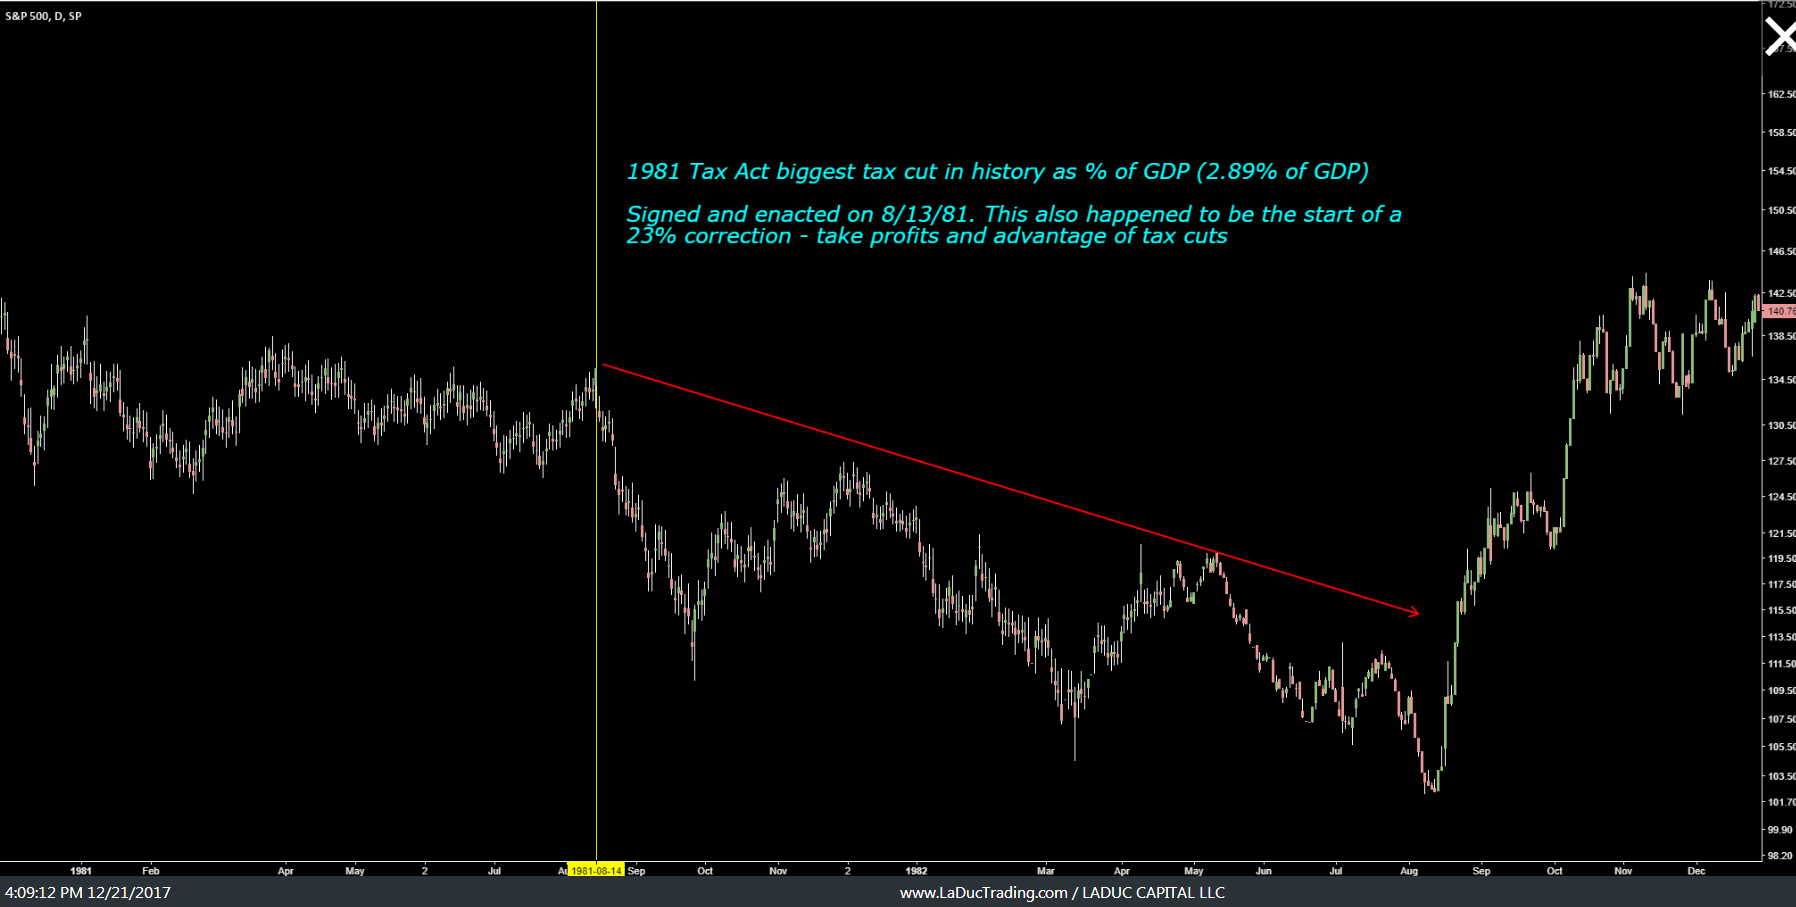
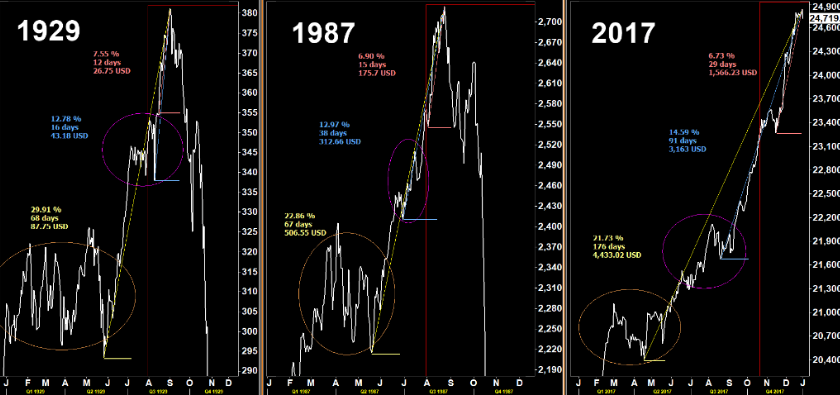
Ed Matts of Matrix Trade put out this interesting fractal with a note:
We have not seen the likes of 2017 in 30 years. Rampant stocks, falling Dollar, stable to firm yields and strong commodities is a combination only seen in 1987 and 1929.
My Stock Bond Volatility Ratio Call
I have a very high win-rate on my proprietary Stock-Bond-Volatility Ratio calls. My SIM March article was good for 700 Dow points. Then this Fall I came out too early with call signaling a pullback in September, the day BOJ came in and re-confirmed their bond buying program and the market rallied – that’s trading! My premature read in October of an impending move down, based on a real trigger, was short-lived and reversed by the trigger itself or should I say buying pressure, not selling. Third time a charm? I think so. Too much has aligned:
- My post entitled Why I’m Not a Raging Bull Anymore is based on the psychology of “be careful what you wish for, you might just get it”. Clearly the market rally of the past year was based on the perception we would have tax reform, infrastructure and deregulation. Now that we have, who is left to buy at these lofty levels? Eventually we reach a tipping point, where markets are priced for perfection, and perception meets reality.
- Even die-hard Republicans, not just the 50 percent of those who voted for Trump, distrust and dislike Trump one year in – and distrust and dislike his forced Tax Reform Bill. Color me skeptical, but I imagine at some point this year, the market will start to doubt Trump and his isolationism policies. Or a by-product of his bully posturing (think China) will appear suddenly (like that China devaluation back in Aug ’15 which caused a market swoon). Point is, the market prices in the truth only after reacting (overreacting) to the best case scenario when it’s ‘happy’ and the worst case when it’s not. Human Nature meets Law of Natural Consequences.
- That same ratio chart is now where I wish it had been but hadn’t stayed patient enough.
We may have climbed 300+ points since my February price target of SPX $2672, but we also lost 10% in the US Dollar, so in reality, we didn’t really gain 300 points in dollar terms. Point is, even with the best case of SPX $3160 next year, based on Potential Growth, I would strongly expect a retrace back to Reality soon after, if not sooner.
With that, Happy New Year, happy trading and don’t forget to hedge!
I made it super easy for you to pop into my LIVE Trading Room for custom analysis and interaction–any time! You choose when to fish: Trade the Open or the Close, make a day of it or stay for the whole month. Happy Trading.
Twitter: @SamanthaLaDuc
Any opinions expressed herein are solely those of the author, and do not in any way represent the views or opinions of any other person or entity.

: Showing Some Signs of Emerging Strength")

