I like to swim with the current rather than against it. That’s why I like to refer to an intermarket analysis tool that I adopted a few years ago to help my clients and I stay on the right side of the trend in the financial markets.
It’s a Stock-Bond-Volatility ratio indicator that combines the 10-Year US Treasury Note (INDEXCBOE:TNX), S&P 500 Large Cap Index (INDEXSP:.INX) and Volatility Index (INDEXCBOE:VIX) prices. It lends itself very well to the type of technical analysis I perform on charts: pattern recognition.
And the pattern that is emerging now signals the outsized, no-volatility, post-election Trump rally is coming to an end soon.
I’ve referred to this indicator on Twitter/Stocktwits as my best “Go-To-Macro Chart” because it typically foretells big macro events. I don’t write about this indicator often, only when it signals to me that Big (captial B) Volatility is about to return to the market and with that a pullback. That doesn’t mean I don’t see the market moving higher after the volatility event has passed. Volatility is after all typically a temporary, albeit, powerful re-pricing tool. Point is: The Trump Mania can continue, as I have written in my 2017 Market Forecast where I submitted a best case of ~$2700 on the S&P 500 this year based on the Potential of tax reform, infrastructure policies and deregulation. I also forecast the rally will be unwound once Reality hits, leading into 2018. But for now, equities have rallied 10% after the election in anticipation that Trumpeconomics will fuel inflation and growth. Logic would dictate that if these policies of lower taxes/fewer regulations and more jobs/infrastructure don’t materialize, the rally will reverse itself.
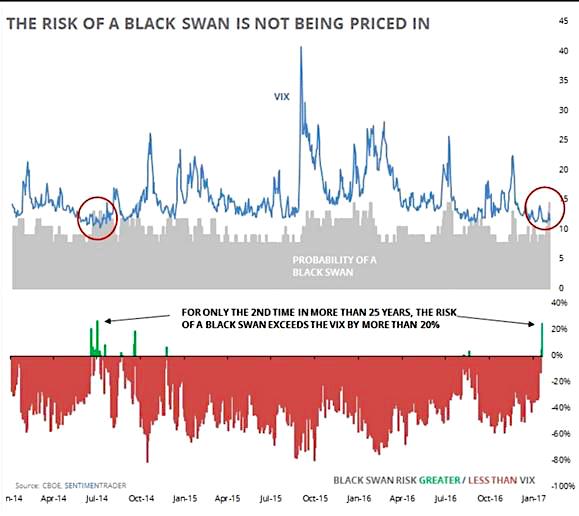
Volatility gets its own forecast. In the same way market pricing reflects an auction between buyers and sellers, volatility reflects their fear or confidence. And the lack of fear, the lack of selling in particular, has greatly suppressed volatility in this post-election market. That’s all about to change. I see a quantifiable trigger that now is the time to be looking for a reversion-to-the-mean type move in the indices. And it’s not because S&P 500 has had 102 straight trading days with no 1% move down, which is unsustainable. I think we’re ready to tumble and I think it’s going to be more than 1-2% down, which to put in perspective we had in the past week post Trump’s State of the Union address.
Repricing in Risk:
In particular, this current situation, which I expect to start to trigger on/after March 15th, mirrors three other times this indicator signaled in 2014. Using Dow Jones Industrial Average (INDEXDJX:.DJI) as reference action (high to low).
All three pullbacks were bought in relatively speedy fashion (read: V-shaped) as the uptrend continued without even a weekly close below the 50 week moving average. And, our first pull back of 2017 may just be that, as we test the waters of this unrelenting bull market and the algorithms that support it.
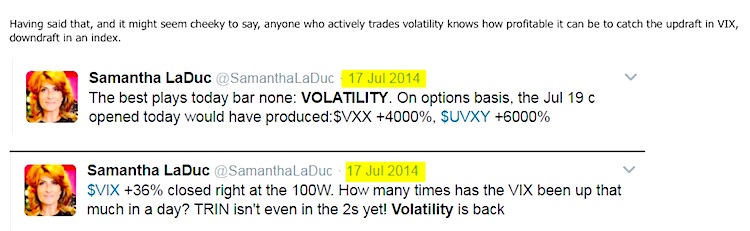
Having said that, and it might seem cheeky to say, anyone who actively trades volatility knows how profitable it can be to catch the updraft in VIX, downdraft in an index.
Current Analysis:
I see the current signal more like 2014 than the Big one in 2015:
- June 30, 2015 and again August 13, 2015 I warned that Volatility was about to return in size and the market lost 210 SPX and 1500 Dow points in flush style soon after.
The indicator is not proprietary but my interpretation is. Trading is not a game of perfect so timing any pullback as an actionable trade, degree or duration, can be hard, but with a good trigger, it pays to be prepared.
It is more than coincidence that we have some Key Macro Events occuring to “justify” a volatility event. From expected FED rate hikes to US debt ceiling, from French elections to Article 50 of EU Brexit, from Russia intrigue to several countries posturing miliatarily, from fiscal policy uncertainty to surprise currency devaluations (China, Japan, Euro). Take your pick and expect the unexpected.
With the market Priced to Perfection, there is no room for FUD (Fear Uncertainty Doubt) let alone policy missteps. And yet, big shocks from policy uncertainty can occur and the amount of policy uncertainty can foreshadow big shocks. My chart read on this one Stock-Bond-Volatility indicator—in combination with an unstable political landscape, a market that is “Priced To Perfection” against a backdrop of overly bullish sentiment—says we will soon face turbulance. So fasten your seatbelts, it’s gonna be a bumpy ride.
Friendly Sidebar: It’s easy to subscribe to my Free Fishing Stories/Blog for more insights like these. You are also invited to Come Fish With Me on any trading day!
Thanks for reading and Happy Trading.
Twitter: @SamanthaLaDuc
Any opinions expressed herein are solely those of the author, and do not in any way represent the views or opinions of any other person or entity.

: Showing Some Signs of Emerging Strength")

