The 24-7 news cycle adds an additional layer of noise to what’s happening in the marketplace.
Though it’s good to be up on news and current events, it’s much more important to remain focused on price trends and your process/methodology.
Below is my latest look at what’s happening in the financial markets… from a macro perspective.
Macro Market Trends
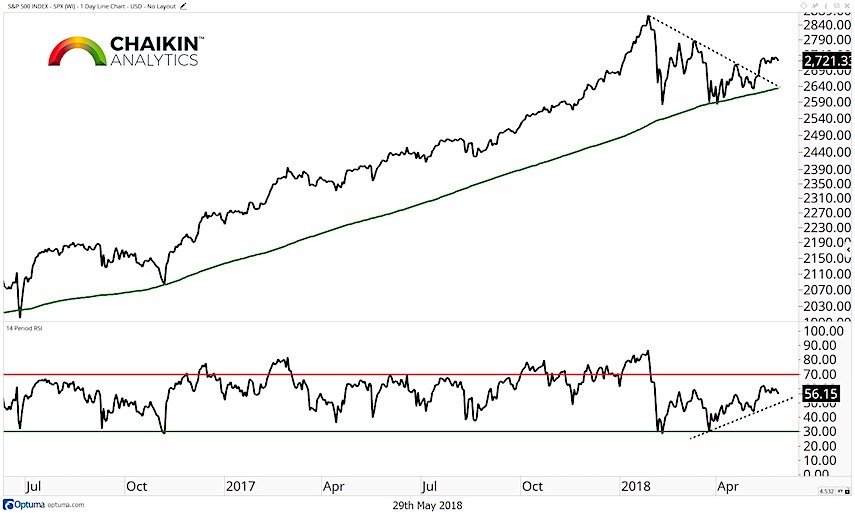
Equities
On a closing basis, the S&P 500 has begun to move sideways after breaking the downtrend line off of the January highs. The index remains above the rising 200-day moving average which keeps the secular uptrend in place. The RSI has stalled after reaching its highest level since the consolidation began.
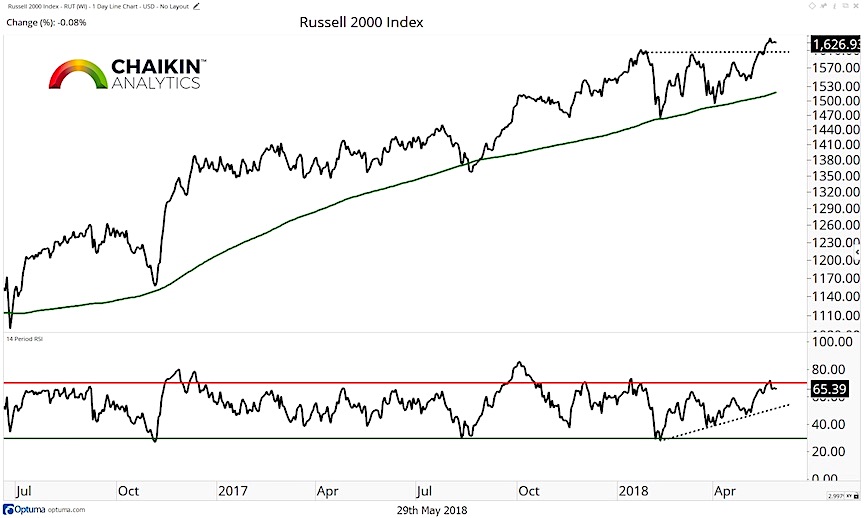
Small Caps Remain Leadership
The Russell 2000 maintains a stronger technical position than the S&P 500, consolidating just below all-time highs following a breakout the previous week. The RSI is in the process of shifting to bullish ranges confirming the strong price action for the index. We continue to favor small cap stocks over large.
Credit
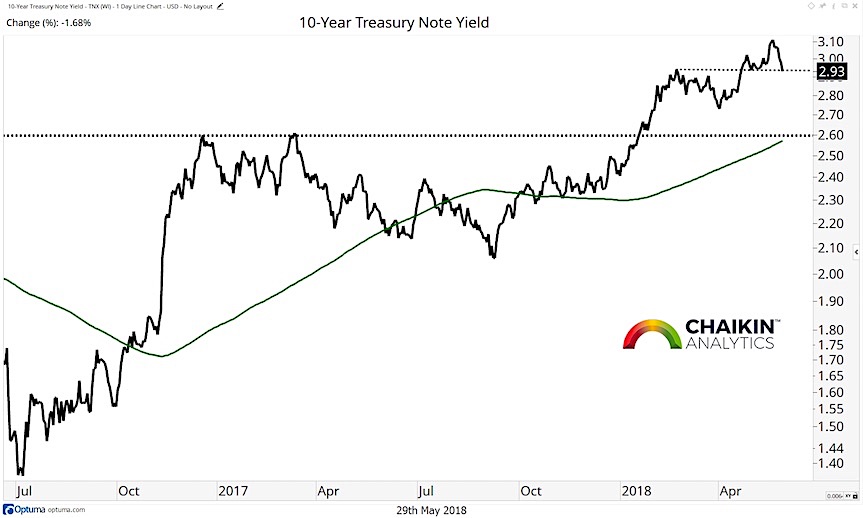
The 10-year yield closed just above short-term support last week after moving back below 3%. We continue to see the path of least resistance as higher for yields and will monitor how rising rates impact the overall stock market should that trend continue.
In fact, we ran an analysis to study how the S&P 500 responds to rising interest rates. Going back to 1963, we found that when the 10-year yield is higher than it was one year prior and is below 5%(such as the current environment), the S&P 500 is higher one year later 89% of the time with a median return of 10.57%. This tells us that rising rates, on their own, are not a cause for concern for the equity market currently.
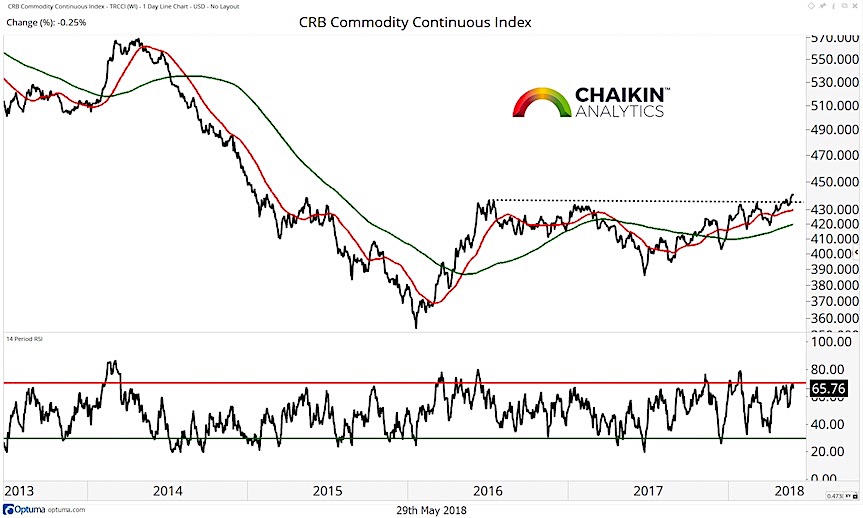
Commodities
Commodities are beginning to move up through resistance despite the pullback in Oil last week The index is trading above the rising 50 and 200-day moving averages signaling the potential for a new uptrend to begin. However, the RSI is moving lower from overbought conditions and has failed to confirm the recent price highs.
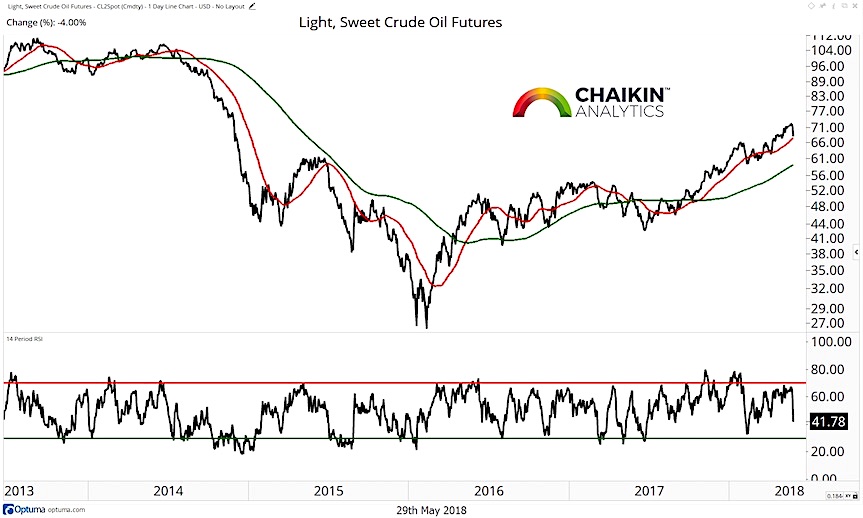
Crude Oil pulled back to the rising 50-day moving average and remains above the 200-day moving average. The RSI plunged last week as Oil sold off after registering a negative divergence with price recently.
The Dollar
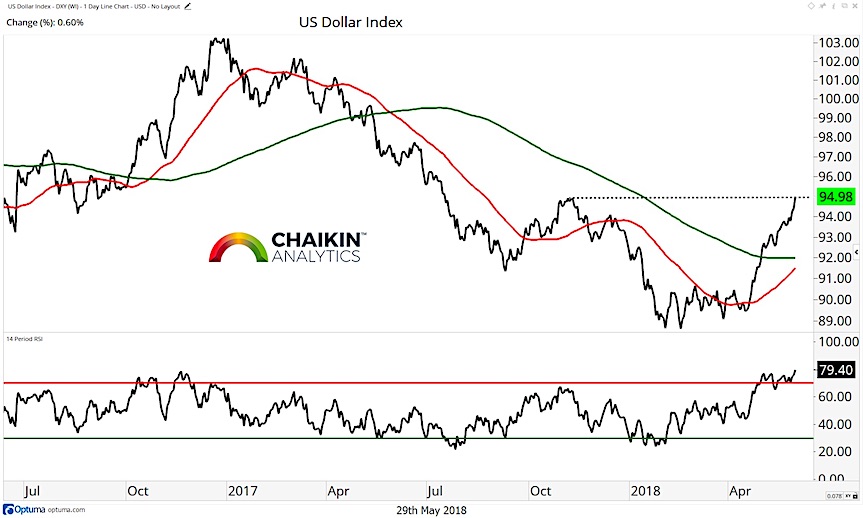
The US Dollar continued to advance last week and is now testing resistance at the 95 level. The Dollar Index is above the rising 50 & 200-day moving averages and the RSI remains in an overbought condition. Given the proximity to resistance and the elevated RSI, it would not be surprising to see the index pause this week.
You can gain more insights into our methodology and stock picking over at Chaikin Analytics. Thanks for reading.
Twitter: @DanRusso_CMT
Author may have a position in mentioned securities at the time of publication. Any opinions expressed herein are solely those of the author, and do not in any way represent the views or opinions of any other person or entity.


