U.S. Equities
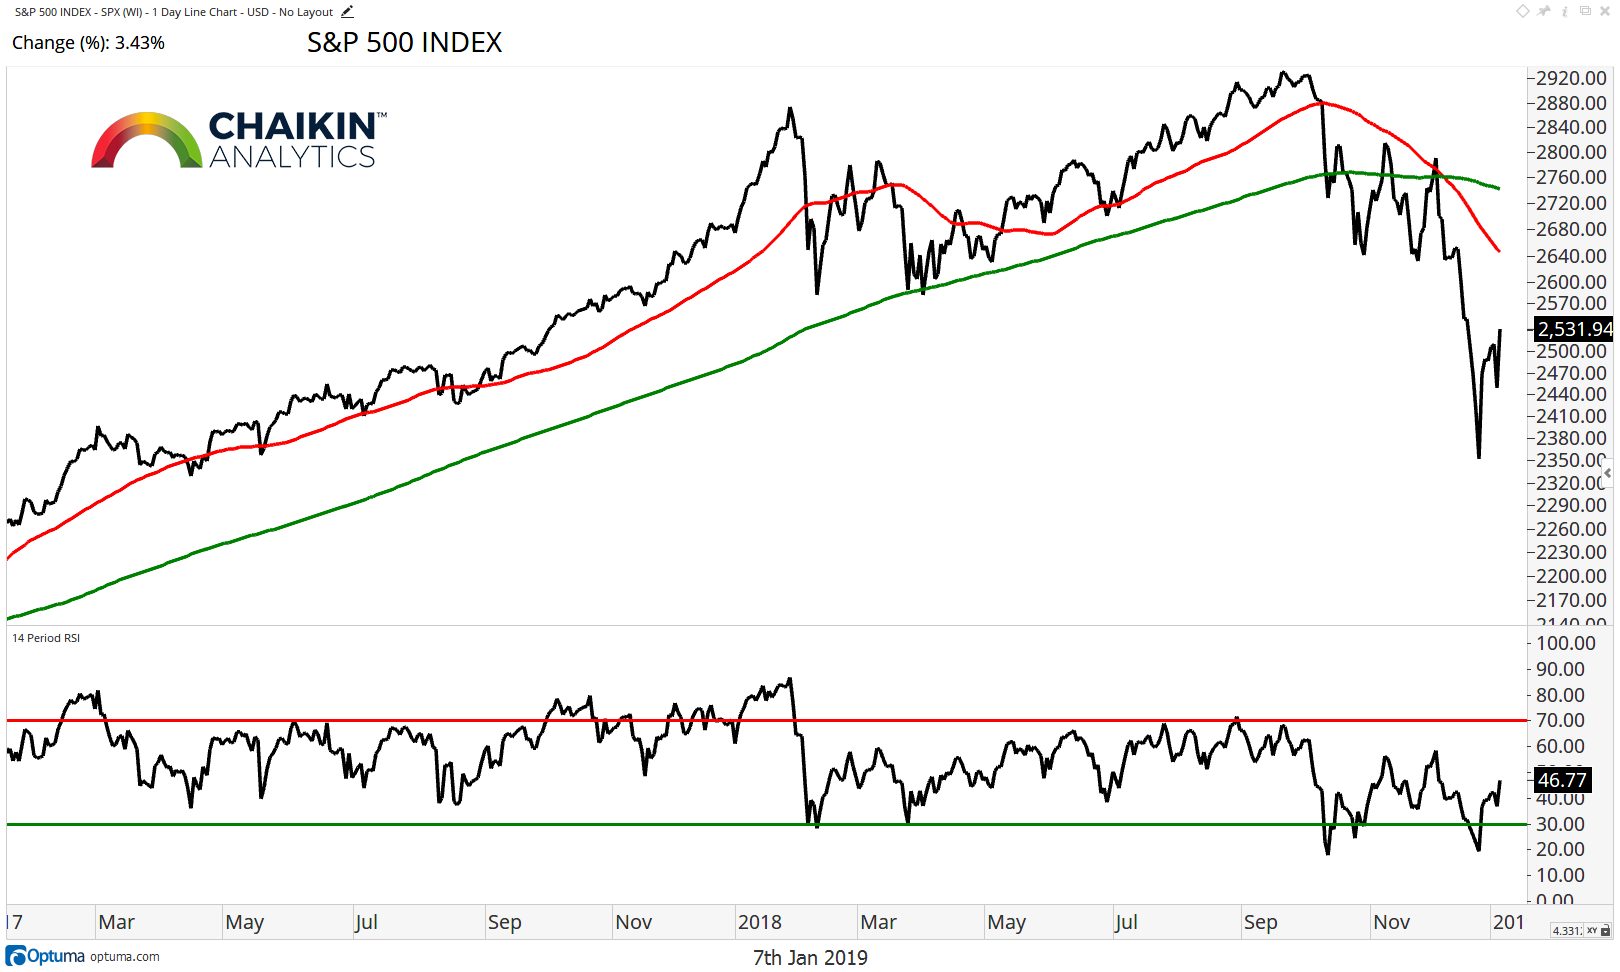
On a closing basis, the S&P 500 has continued to move higher from the lows established on Christmas Eve.
The strength has taken the index back to resistance at the February 2018 lows near 2,530. Should the index break through this level there is still a fair amount of overhead supply with the next resistance level in the 2,600 – 2,630 zone.
The S&P 500 remains below the falling 50 and 200-day moving averages while the RSI is in bearish ranges, lending a momentum confirmation to the bearish price trend. For now, support is near the recent lows at 2,350.
Small Caps
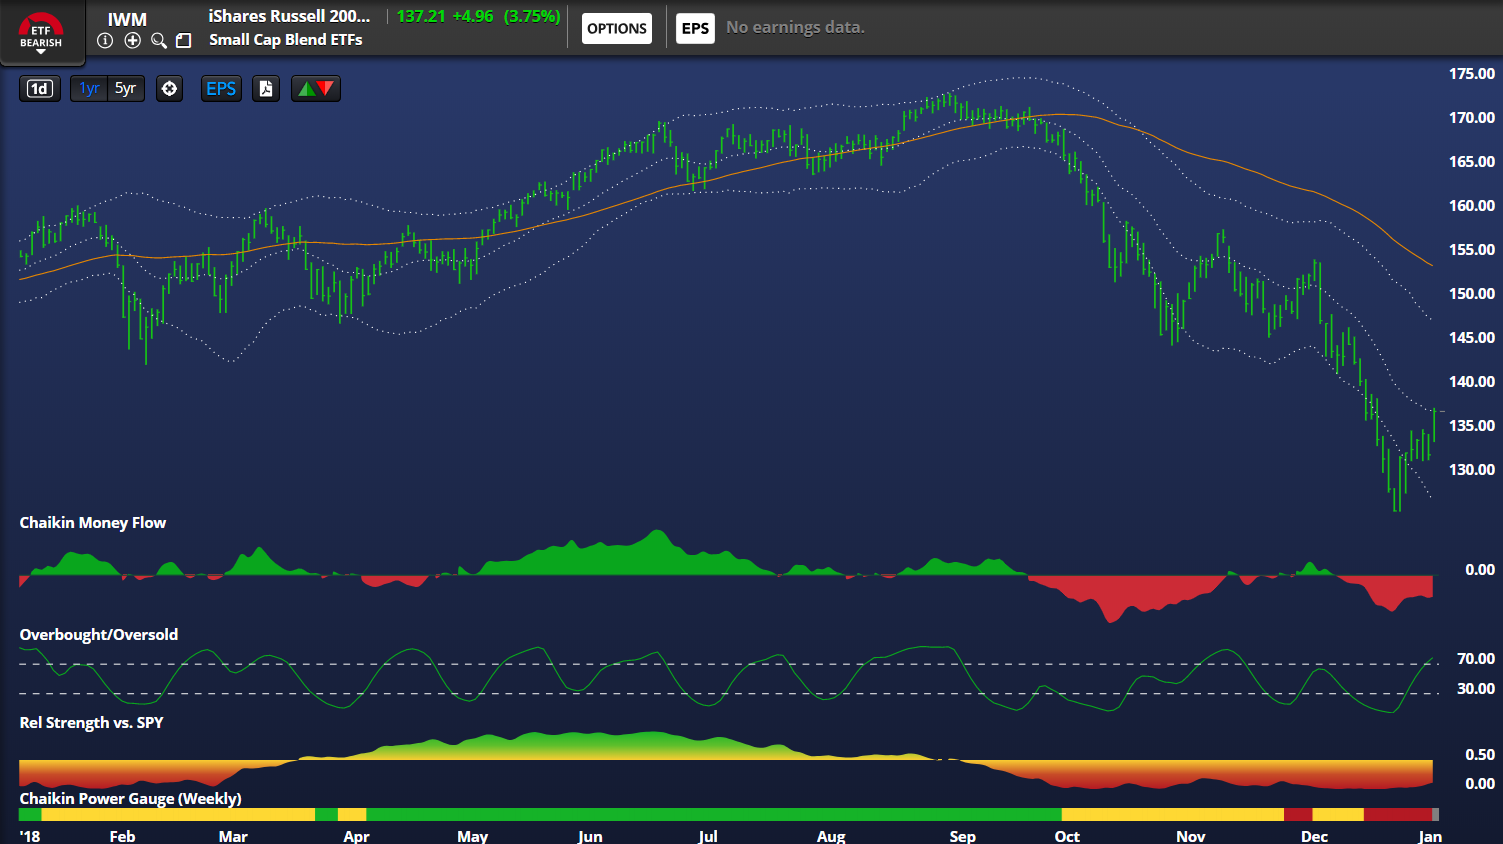
The iShares Russell 2000 ETF (IWM) has a Bearish Chaikin Power Gauge ETF Rating and continues to underperform the SPY. The fund is now overbought and nearing resistance in the $140 – $145 zone. Despite the recent rally, Chaikin Money Flow remains bearish and the IWM is below the falling long-term trend line.
Fixed Income
The 10-year yield closed at 2.66%, continuing to move lower before testing support in the area around 2.6%. The yield remains below the 200-day moving average, but the RSI has reached oversold levels, signaling the potential for a move higher in the near-term. However, the path of least resistance remains lower for yields which should benefit the bond proxies in the equity market.
Commodities
The CRB Commodity Index has made a move higher from support after nearing an oversold condition. The index remains below the declining 50 and 200-day moving averages and the RSI is in bearish ranges. If commodities are able to stabilize, there is the potential for a bottoming process to begin in the Materials sector.
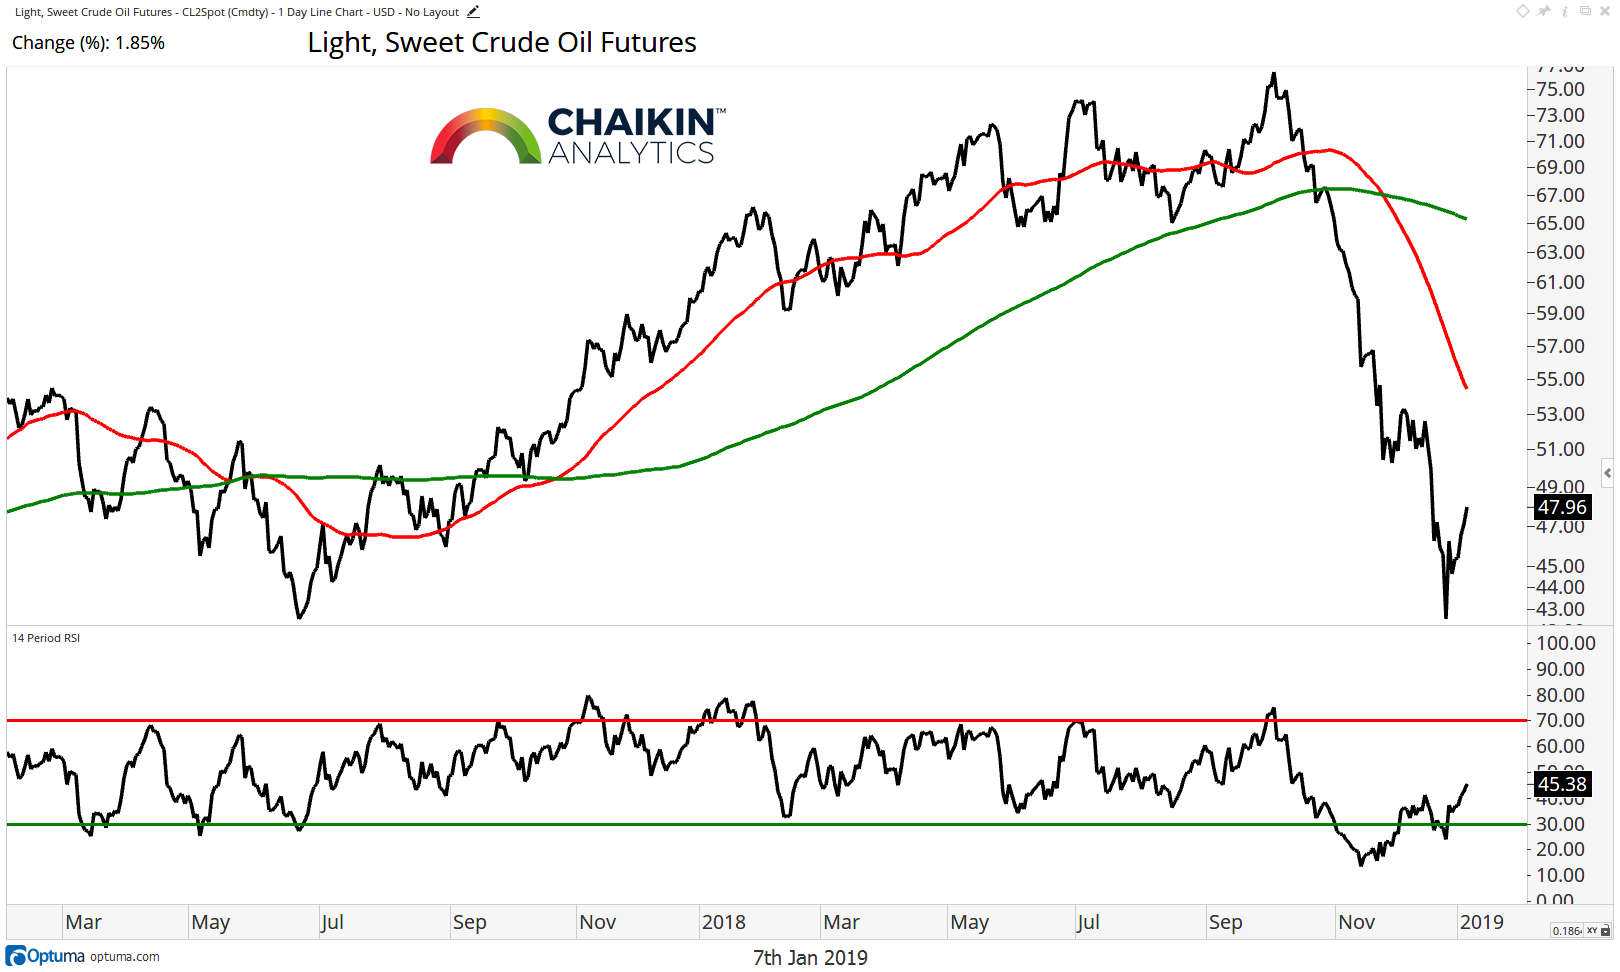
Crude Oil has held support at the lows from June 2017 near $43 but remains below the 50 and 200-day moving averages. The RSI has moved out of a deeply oversold position but remains in bearish ranges, confirming the weakness in price. Energy stocks are weak with the price of crude and we await stabilization in both the commodity and the equities.
The Dollar
The Dollar Index continues to move lower, falling below the 50-day moving average. The index remains above the 200-day moving average, but the RSI has marked a series of lower highs recently. Should the dollar break lower, it could be a catalyst for a stabilization in commodity prices. The key level will be $94 which would take the index below the 200-day moving average.
Twitter: @DanRusso_CMT
Author may have a position in mentioned securities at the time of publication. Any opinions expressed herein are solely those of the author, and do not in any way represent the views or opinions of any other person or entity.


 Flirting With Critical Support… Again")