My firm Avory & Co just finished up our July Stock Market Seasonality Research Report for the S&P 500 (NYSEARCA:SPY).
Here are some of the historical data and highlights…
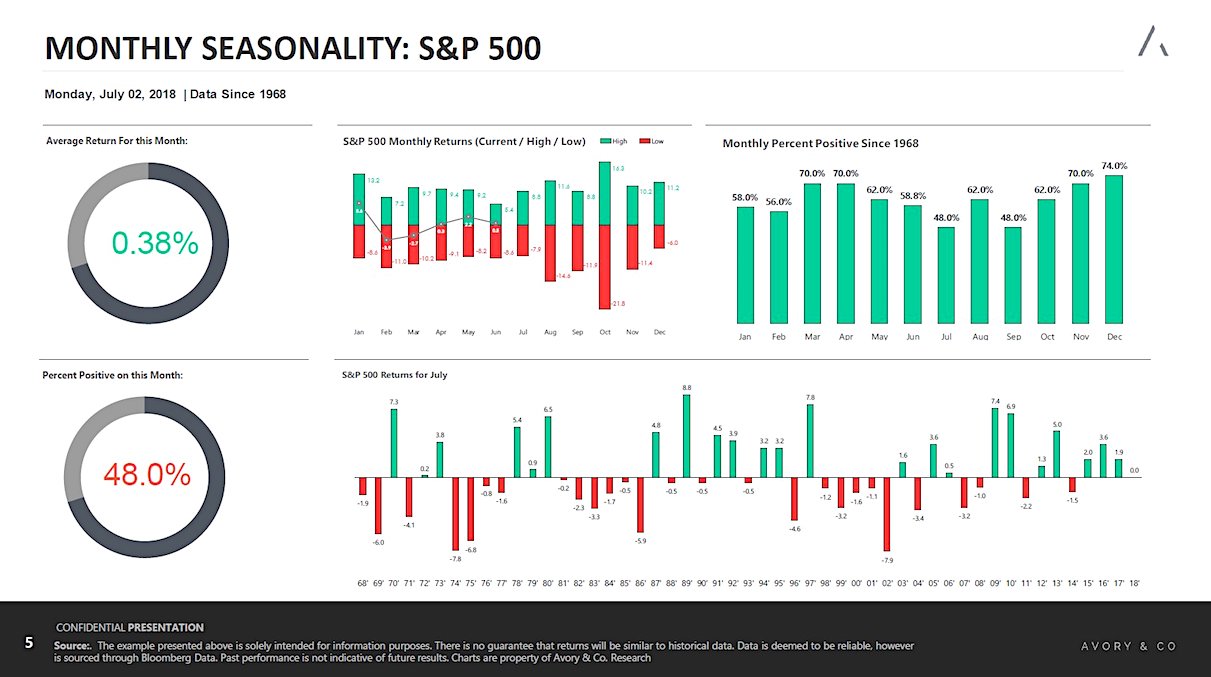
July stock market seasonality:
1. July is up only 48% of the time, tied with September for the worst month.
2. The average return for July is 0.38%.
3. July 2nd is historically the 5th worst day of the month.
4. July is up 3 years in a row, tied for the longest streak over 50 years. The prior streak started in 1978 and ended in 1981 with -0.2% decline.
5. The worst July return ever was -7.9% in 2002, the second best max drawdown for any month. December is the best at only -6% max drawdown.
6. If you only invested in July since 1968, you would just be up roughly 20%.
7. From Jan to June the stock market is below the typical annual seasonality.
8. Q3 is the worst quarter, in terms percent positive, up 62% of the time.
9. The Q3 averages a 0.72% return.
Twitter: @_SeanDavid
Any opinions expressed herein are solely those of the author, and do not in any way represent the views or opinions of any other person or entity.

: Cup (and Maybe Handle) Watch")
 Reaches Important Price Support")

