The following is a recap of the July 8 COT Report (Commitment Of Traders) released by the CFTC (Commodity Futures Trading Commission) looking at COT data and futures positions of non-commercial holdings as of July 5. Note that the change in COT report data is week-over-week. This blog post originally appeared on Hedgopia.com – Paban’s blog.
Trading Insights and Analysis from the July 8 COT Report
COMMODITIES
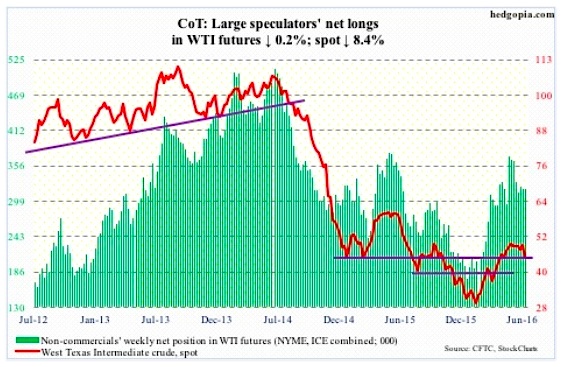
Crude Oil –
The seven weeks of sideways action after a nearly doubling of the price in four months was resolved this week – with crude oil breaking to the downside. Spot West Texas Intermediate crude oil lost 8.4 percent for the week, losing $46/barrel a support as well as the 50-day moving average.
Continuation of good news on the stocks front did not help. Technicals prevailed.
In the week ended July 1st, crude oil stocks fell by 2.2 million barrels to 524.4 million barrels. They are now down 19 million barrels from the April 29th high of 543.4 million barrels, which was the highest since the all-time high 545.2 million barrels in October 1929.
Gasoline stocks declined 122,000 barrels to 238.9 million barrels. And distillate stocks contracted 1.6 million barrels to 148.9 million barrels – the lowest in seven months.
U.S. crude oil production continues to drop, down another 194,000 barrels per day to 8.4 million b/d. Production peaked at 9.61 mb/d in the June 5th week last year.
Crude oil imports, however, rose 808,000 barrels to 8.4 mb/d. Plus, refinery utilization fell five-tenths a point to 92.5 percent; the prior week was a 29-week high.
On the weekly chart, there is plenty of downside risk still, with support at $42.50-$43, followed by the 200-day moving average ($41.11).
July 8 COT Report Data: Currently net long 318.5k, down 752.
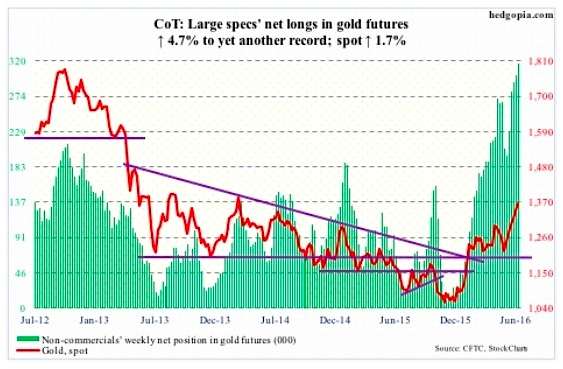
Gold –
One more weekly gain for spot gold – its sixth consecutive. Rallied 1.7 percent this week. Flows continue to cooperate.
The SPDR Gold ETF (NYSEARCA:GLD), attracted another $1.4 billion in the week ended Wednesday. This follows gold inflows by a like amount in the prior week.
In the five weeks to Wednesday’s intra-day high, spot gold rallied nearly 15 percent. GLD attracted $4.7 billion during that time.
The daily chart for gold is beginning to look extended, with a spinning top on Thursday. It is a neutral candle, and signals indecision. Having come after such a nice rally, some unwinding is possible. Friday produced a long-legged doji.
That said, non-commercials continue to accumulate net longs – yet another record.
July 8 COT Report Data: Currently net long 316k, up 14k.
EQUITIES
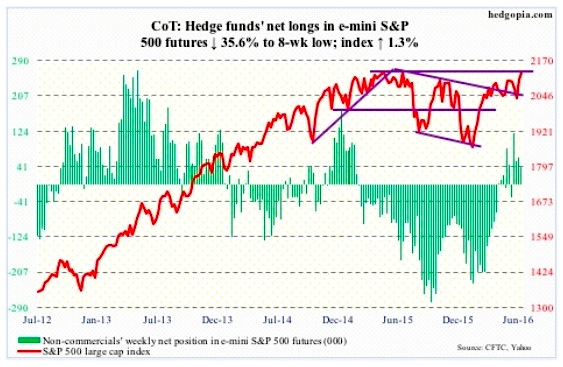
E-mini S&P 500 –
Post-Brexit two-session sell-off was risk-off, with the S&P 500 Index (INDEXSP:.INX) dropping 5.3 percent. The subsequent four-session, 5.1-percent surge through Friday last week was risk-on. But amidst this risk-on behavior, defensive sectors did very well, 10-year Treasury yields made new lows, and gold continued to shine.
This would normally make it hard to put solid odds on chances of sustained breakout on the index, which has gone sideways for the past 16 months. But it is tantalizingly close. Friday’s post-jobs 1.5-percent rally brings the index right underneath the May 2015 high. In fact, on a closing basis, it has broken out, albeit by only a few points.
We are in the midst of earnings season, with low hurdle to jump. Bulls have the ball.
A lot is going to depend on whether or not flows improve. The SPDR S&P 500 ETF (NYSEARCA:SPY), did indeed attract $4.6 billion in the week ended Wednesday. This followed outflows of $7.7 billion in the prior week (courtesy of ETF.com).
U.S.-based equity funds, however, continued to bleed. In the same week, another $1.4 billion left U.S.-based equity funds. In just the last 10 weeks, $45 billion has been redeemed.
July 8 COT Report Data: Currently net long 39.9k, down 22.1k.
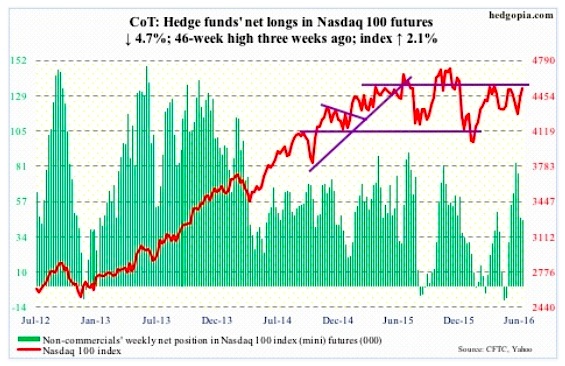
Nasdaq 100 Index (mini) –
The PowerShares Nasdaq 100 ETF (NASDAQ:QQQ), continues to struggle to attract funds. It lost $351 million in the week ended Wednesday. Last week, it lost $701 million (courtesy of ETF.com).
The Nasdaq 100 is past 4350, which has been an important price point going back to November 2014, and is literally sitting on the declining trend line from November 2015. A breakout would be a big win for the bulls.
July 8 COT Report Data: Currently net long 44.6k, down 2.2k.
continue reading on the next page…

 Testing Important Price Support")
: Cup (and Maybe Handle) Watch")

