The following is a recap of the July 1 Commitment Of Traders COT Report released by the CFTC (Commodity Futures Trading Commission) looking at COT data and futures positions of non-commercial holdings as of June 28. Note that the change in COT report data is week-over-week. This blog post originally appeared on Hedgopia.com – Paban’s blog.
Trading Insights and Analysis from the July 1 Commitment of Traders Report
COMMODITIES
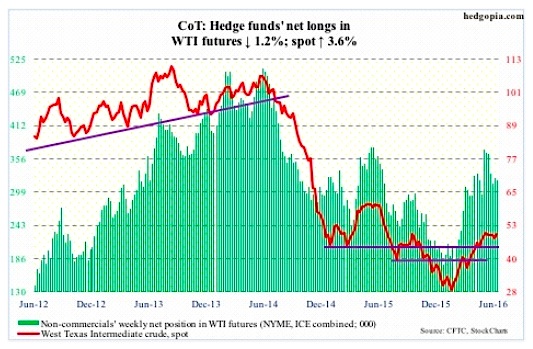
Crude Oil
Quick return of risk-on attitude among traders and better news on U.S. crude oil stockpiles helped spot West Texas Intermediate crude rally 3.6 percent in the week.
In the week ended June 24th, oil stocks fell by 4.1 million barrels to 526.6 million barrels. They are now down 16.8 million barrels from the April 29th high of 543.4 million barrels, which was the highest since the all-time high 545.2 million barrels in October 1929.
Distillate inventory shrank by 1.8 million barrels to 150.5 million barrels. Stocks have declined 15 million barrels in the past 25 weeks.
Gasoline stocks, however, saw an increase of 1.4 million barrels to 239 million barrels.
U.S. oil production continues to drop, down another 55,000 barrels per day to 8.6 million b/d. Production peaked at 9.61 mb/d in the June 5th week last year.
Crude oil imports declined 884,000 b/d to 7.6 mb/d. The prior week was the highest since October 2012.
Refinery utilization rose, too, up 1.7 percentage points to 93 percent – a 29-week high.
As things stand now, the best spot WTI crude oil could achieve near term is rally to the June 9th high of $51.67/barrel. It remains overbought on the weekly chart, with sideways action the past seven weeks.
July 1 Commitment of Traders Report: Currently net long 319.3k, down 3.9k.
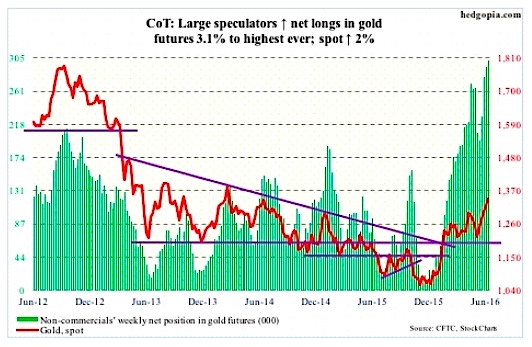
Gold
Money continued to flow into the SPDR Gold ETF (NYSEARCA:GLD). Another $1.4 billion made it into the ETF in the week ended Wednesday. This followed gold inflows of $629 million in the prior week.
For the week, spot gold prices rallied another two percent – fifth consecutive up week.
Last week’s high $1,362.6 nearly tested $1,381, which is a 38.2-percent Fibonacci retracement of the decline between September 2011 and December 2015.
If for whatever reason the metal comes under pressure, it has carved out another support zone in the $1,260 area. This is the price area gold broke out of in June after four months of consolidation.
For now, non-commercials are not expecting a sizable pullback in gold. Net longs rose to another record.
July 1 Commitment of Traders Report: Currently net long 301.9k, up 9.2k.
EQUITIES
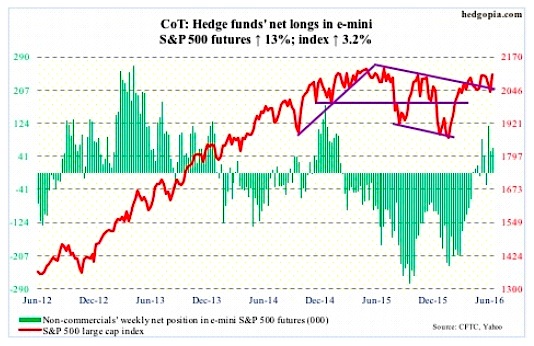
E-mini S&P 500
Bulls put foot down where they could possibly have. Support at 1990 stretches back to July 2014, and was vigorously defended on Monday. Off the Monday low, in the next four sessions, the S&P 500 Index (INDEXSP:.INX) rallied 5.6 percent. The post-Brexit two-day sell-off was 5.3 percent.
There is a weekly hammer on the chart – similar to August last year and January this year. Back then, after the initial trough, and the subsequent rally, those lows were successfully tested in September and February, producing another hammer reversal. The rallies that followed were massive on both occasions. Will the S&P 500 Index follow the same playbook this time around? Remains to be seen.
For now, in the week ended Wednesday, another $6.8 billion left U.S.-based equity funds. From the week ended February 10th, $60 billion has been redeemed (courtesy of Lipper).
During the same week, the SPDR S&P 500 ETF (NYSEARCA:SPY) lost $7.7 billion (courtesy of ETF.com), with Tuesday and Wednesday in which the index rallied four percent unable to attract funds, losing $2.8 billion.
July 1 Commitment of Traders Report: Currently net long 61.9k, up 7.1k.
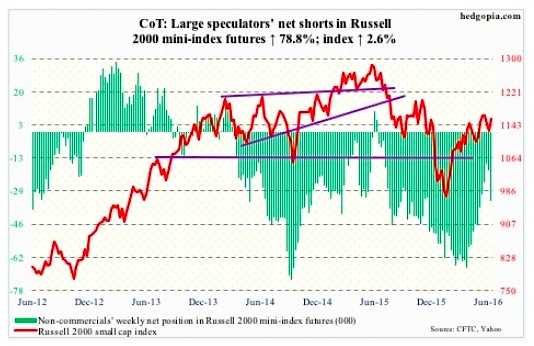
Russell 2000 mini-Index
The post-Brexit loss of 50- and 200-day moving averages was recaptured in no time. That said, as is the case with other stock market indexes, the Russell 2000 Index remains below pre-Brexit high. For the week, small-cap stocks also rallied less than other major indices.
In the week ended Wednesday the iShares Russell 2000 ETF (NYSEARCA:IWM), lost $770 million, with outflows of $626 million on Tuesday and Wednesday. The Russell 2000 Index rallied 3.9 percent in those two sessions. At least until Wednesday, there were plenty of doubters if the rally would stand.
July 1 Commitment of Traders Report: Currently net short 34.3k, up 15.1k.
continue reading on the next page…


