If the U.S. Dollar continues to rally, as we showed in the forecast we posted in May , then it should set up favorable conditions for short trades with respect to paired currencies. Often we chart those developments using futures contracts, but there are also several forex ETFs that are widely traded. Here we project the next stages of decline in the Japanese Yen, as reflected by the CurrencyShares Japanese Yen Trust (symbol FXY). Also, our newsletter coming out later this week will highlight a selection of additional currency opportunities. (Scroll down for details.)
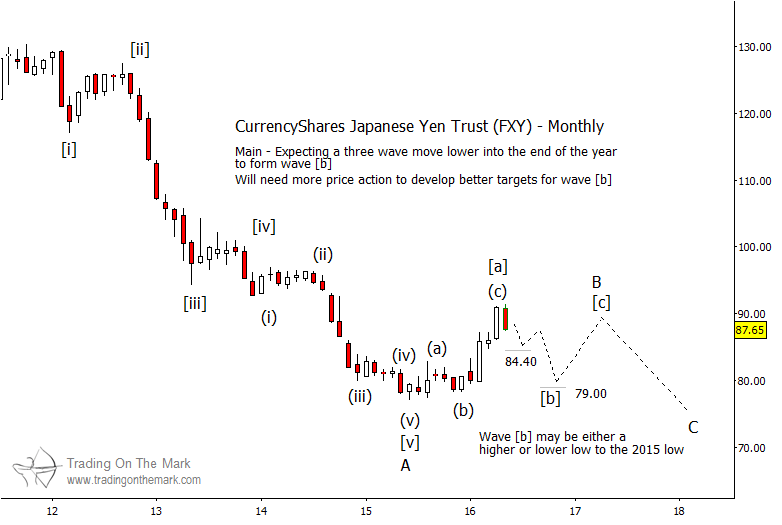
In the big picture, we believe the Yen is forming a very large corrective wave pattern – one that began in 2011 and could continue into 2018 or beyond. The first leg of that Japanese Yen wave pattern was the steep decline from 2011 into the low of 2015, which counts as a five-wave move and is labeled as ‘A’ on the monthly chart below.
With the completion of ‘A’, price began tracing a smaller corrective pattern which we are calling ‘B’. We don’t believe ‘B’ is finished yet. The next development should be a downward move as sub-wave [b] of ‘B’. With the FXY fund, likely support areas include 84.40 and 79.00 for price to test later this year.
For anyone trading short, it will be important not to overstay in the position. After price finishes moving through sub-wave [b] of ‘B’, we should see it rally in [c] of ‘B’.
Japanese Yen Wave Pattern – $FXY Monthly Chart
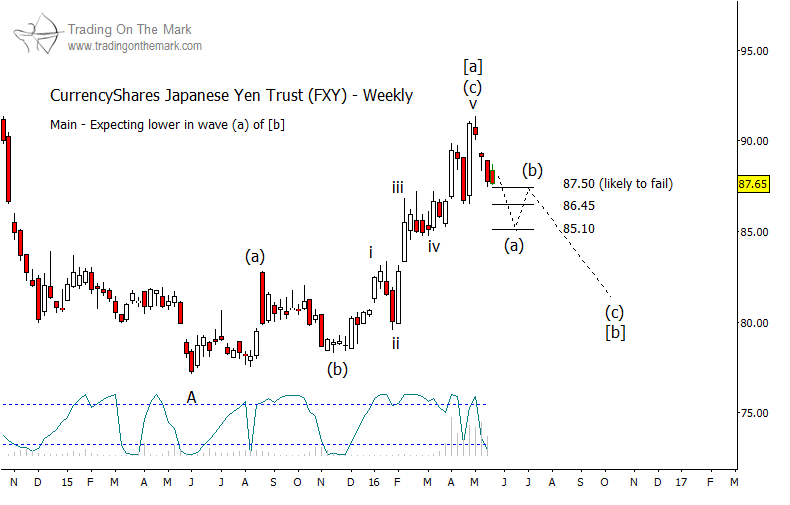
Note that we drew the pending decline as a three-wave move into [b]. That is the most likely Japanese Yen wave pattern, although others are possible. If the decline acts as we believe it will, then the current, small leg of the pattern probably has farther to go. As depicted on the weekly chart below, price should test one or more of the potential support areas near 87.50, 86.45, and 85.10 before attempting a noticeable bounce. Eventually the decline should resume, and the target area of 79.00 from the monthly chart might come into play.
Japanese Yen Wave Pattern – $FXY Weekly Chart
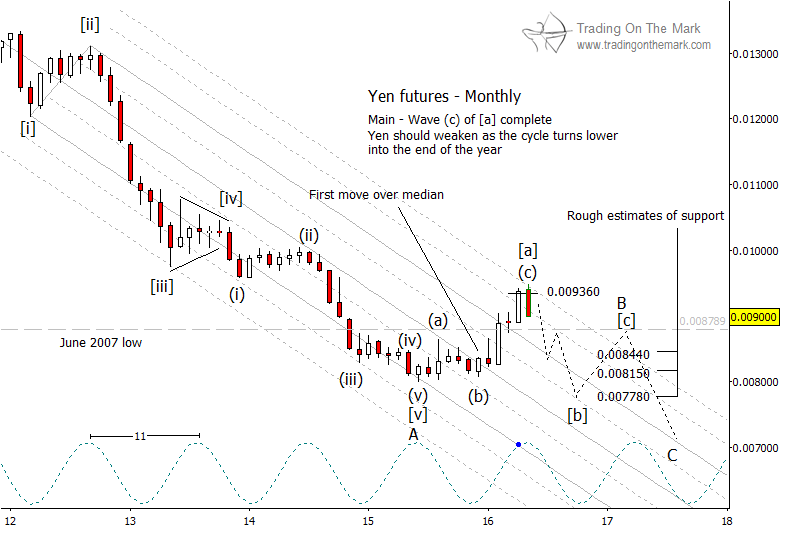
Our chart of the Yen futures contract can help in timing the trades. For several years we have been following an 11-month cycle that has given good predictions of important highs and lows in the Yen. The recent high aligned nicely with the cycle. If the cycle keeps working, then the next two major lows should be around autumn 2017 and summer/autumn 2018.
Japanese Yen Wave Pattern – (Futures) Monthly Chart
You can read about more currency setups in our forthcoming newsletter, coming out later this week. Request your copy via this link.
Thanks for reading.
Twitter: @TradingOnMark
No position in any of the mentioned securities at the time of publication. Any opinions expressed herein are solely those of the author, and do not in any way represent the views or opinions of any other person or entity.
: Creating Bullish Divergence?")


 and Semiconductors (SMH): Concerning Price Pattern?")


