When we wrote in April about the CurrencyShares Japanese Yen Trust ETF (NYSEARCA: FXY), we suggested that the preceding rally was exhausted and that nearby resistance should hold.
That forecast worked very well, and the correct trade from that point was downward.
However, the lack of a forceful follow-through has led us to move a slightly different Elliot wave count to the fore.
You can see the big-picture downward impulsive structure for the Yen and FXY in the monthly chart we tweeted recently. The low in 2015 was probably the end of large Elliott wave [iii] in an impulse that began in 2011.
The question then has been how to count the corrective action since 2015 within the framework of a fourth wave. On the monthly chart referenced above, we show how it can be viewed as a triangle wave [iv] still in progress, or alternately as having completed wave [iv] and now starting to embark on downward wave [v].
In both scenarios, we expect a modest upward retrace soon that should still be large enough to attract traders who watch weekly charts. If your time frame is slower than that, you might pay attention to the Yen and FXY when they eventually test resistance at the upper end of the converging range, perhaps later this year.
On the weekly chart below, we have emphasized the primary (triangle) scenario, but both the primary and alternate call for an upward move that should look corrective and will probably consist of three sub-waves.
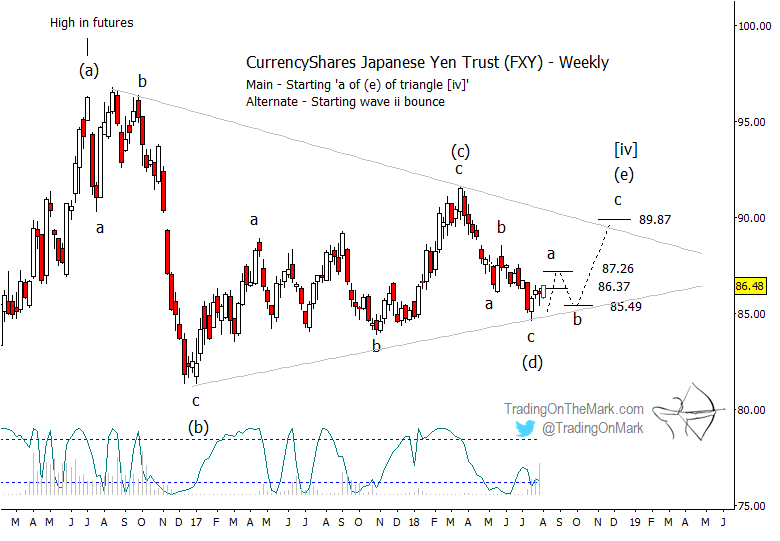
Nearby resistance levels to watch include 86.37 and 87.26 based on retracement increments. A support level that is roughly in line with the expected lower boundary of the triangle sits at 85.49.
In both the primary and alternate scenarios, the upward retrace should find resistance if it tests the area near 89.87, and it should not exceed the level of the earlier high, marked as wave (c), at 91.62.
Eventually price should break downward to reach beneath the 2015 low, and we have identified 74.79 as a preliminary support area as shown on the monthly chart on Twitter.
There are still a few days left for you to take advantage of our special summer subscription offer so you can get this kind of charting and analysis for a wide range of markets every day. With morning and evening updates, Trading On The Mark regularly covers the S&P 500, crude oil, the Euro, Dollar Index, treasury bonds, and gold.
Twitter: @TradingOnMark
The authors may have a position in the mentioned securities at the time of publication. Any opinions expressed herein are solely those of the author, and do not in any way represent the views or opinions of any other person or entity.

: Showing Some Signs of Emerging Strength")

