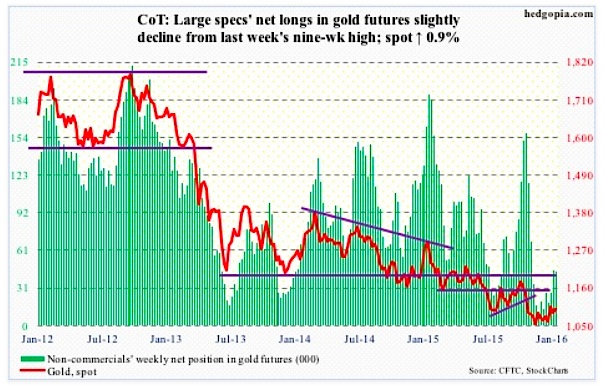
Gold: Spot gold prices have probably not benefited as much as it should have in the current carnage.
That said, there is some technical improvement.
Gold has managed to rally past resistance at 1,080 and stayed above, with the 50-day moving average no longer dropping. There is now a bullish weekly MACD crossover on the Gold price chart.
The 200-day moving average lies at 1,135, which approximates resistance at 1,140-ish for Gold.
January 22 COT Report Data: Currently net long 43.7k, down 1k.
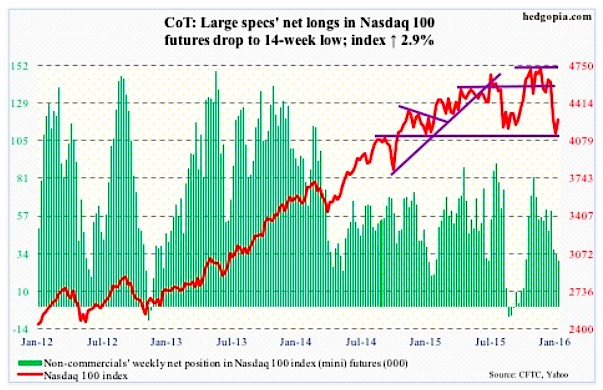
Nasdaq 100 Index (mini): The Wednesday reversal was impressive – down 3.7 percent at one point but ended the session down 0.26 percent.
In a larger scheme of things, the index is still down 10 percent off December’s all-time highs. In many ways, the two-week drop has an ominous look to it. The only way it is negated is if stock flows improve.
In the week ended Tuesday, $428 million came out of the PowerShares QQQ ETF (QQQ) – courtesy of ETF.com. That was just before the Wednesday reversal. Would this advance tempt inflows? This will hold the key as to how far this stock market rally goes.
For the bulls to be taken seriously, they need to clear resistance at 4350, which goes back to November 2014.
Per the January 22 COT report, non-commercials reduced net longs further… a 14-week low.
January 22 COT Report Data: Currently net long 29.1k, down 4.2k.
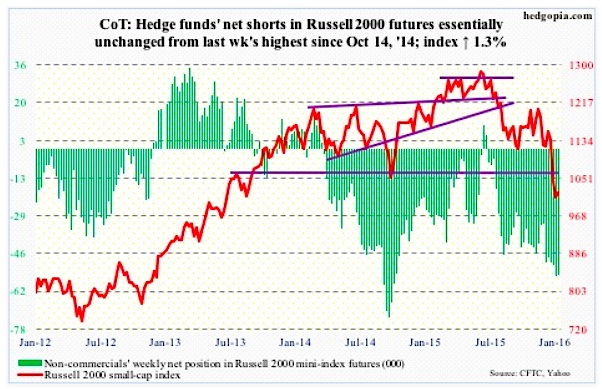
Russell 2000 mini-Index: In the midst of the sell-off on Wednesday, small-caps stocks were one of the areas that began to attract bids. Bio-techs were another. When it was all said and done, the Russell 2000 ended up 0.45 percent, reversing an earlier 3.7-percent drop.
In the following two sessions, the Russell 2000 struggled to garner the same momentum.
In the week ended Tuesday, $1.3 billion came out of the iShares Russell 2000 ETF (IWM) – courtesy of ETF.com. In all likelihood, these sellers will take their time to put their toes back into the water, if at all.
Sentiment can improve a whole lot if the index can conquer two-year resistance at 1080.
January 22 COT Report Data: Currently net short 54.9k, down 159.
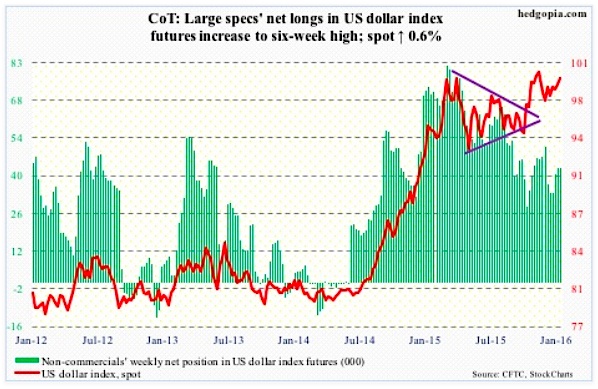
US Dollar Index: Has hugged the 50-day moving average since early December. The average is now beginning to flatten out.
Having failed to appreciably rally during the recent market mayhem, the path of least resistance near-term is probably down.
That said, the index is not that far away from the highs of March and November last year. And non-commercials continue to act like they do not anticipate a breakout. Per the January COT report, futures holdings are substantially less versus back then.
January 22 COT Report Data: Currently net long 42.8k, up 56.
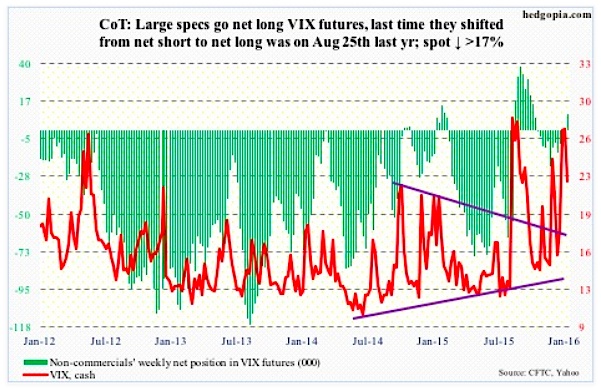
VIX Volatility Index: Several times in the past week or so, spot VIX Volatility Index would repeatedly spike intra-day only to close substantially off sessions highs. This was once again in evidence on Wednesday when the spot shot up to 32.09, only to close at 27.59.
This inability to hang on to gains was a big tell. On Friday, the VIX fell out of a three-week rising channel. More weakness probably lies ahead. The 50- and 200-day moving averages lie at 19.38 and 17.28, in that order.
And then there’s this: Non-commercials went net long. The last time they shifted from net short to net long was on August 25th; the S&P 500 bottomed a day earlier.
January 22 COT Report Data: Currently net long 9.5k, up 16.1k.
Thanks for reading.
Twitter: @hedgopia
Read more from Paban on his blog.
Any opinions expressed herein are solely those of the author, and do not in any way represent the views or opinions of any other person or entity.


