If the Italian stocks ETF we’ve been tracking is on the verge of completing a triangle, the next trending move could take it down to about half its current value.
There are some reasons to believe that a new downward trend has begun for Italian stocks, although it is too early to be certain. This post offers an update on things for Italy “bears” to watch for in the iShares MSCI Italy ETF (NYSE Arca: EWI).
The Elliott wave triangle remains intact. For the pattern to be a valid triangle, price must not go above the 2014 high of 36.88. In fact price may already have begun reacting to the area near the overhead resistance calculated to be 34.80 on a monthly chart.
Initial confirmation of a change in trend would come with a monthly close beneath 31.06 support, and a breach of that level would open the chute for price to challenge the next support at 28.89.
iShares MSCI Italy (EWI) Monthly Chart
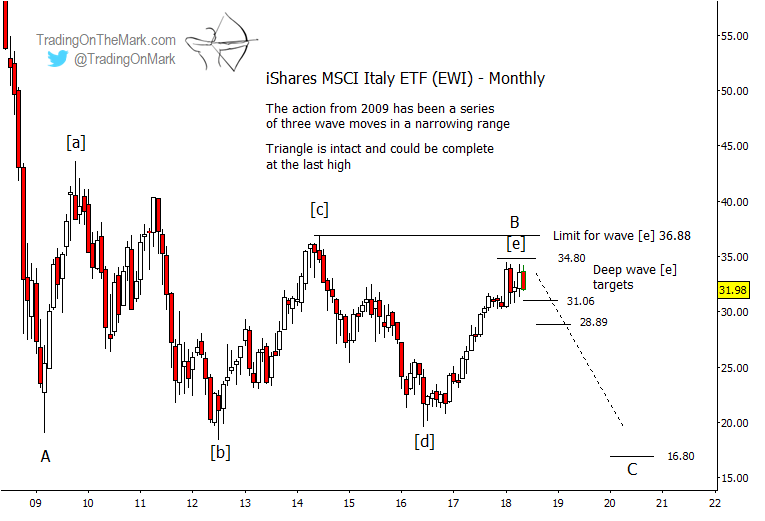
The most probable downward target area in relation to the big triangle and the move that preceded it would be near 16.80, or about half of the fund’s current share value.
The tiny lower high (or loosely a “double top”) that formed during the past few months might give aggressively bearish traders a structure around which to base their stops even before lower supports are breached. We examine that more closely on the weekly chart.
iShares MSCI Italy (EWI) Weekly Chart
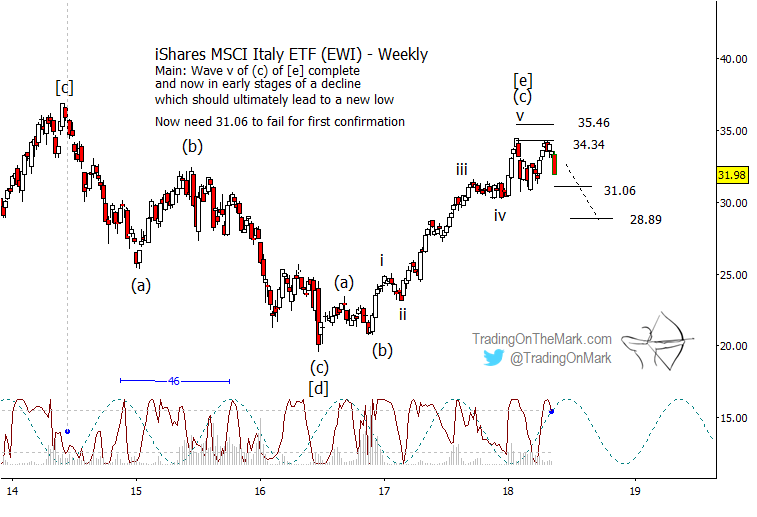
On a weekly chart you can see that price has twice tested the finer-grained resistance level near 34.34. The required form of the triangle’s final swing might have been completed at the first test, although another high is still possible.
The dominant 46-week price cycle shown on the weekly chart would be consistent with price beginning to fall from near its current area.
Looking for a trader’s edge? Every morning Trading On The Mark presents subscribers with charts for the S&P 500, crude oil, gold, treasuries, the Dollar and the Euro. As with the examples in this post, we emphasize the areas to watch for turns to commence. Check out our subscription plans and be sure to follow us on Twitter.
Twitter: @TradingOnMark
The authors may have a position in the mentioned securities at the time of publication. Any opinions expressed herein are solely those of the author, and do not in any way represent the views or opinions of any other person or entity.


