The consolidation pattern we have been monitoring in Italian stocks appears ready to swing into its next phase. Readers might recall our post in late November 2017 which forecast a lower high developing in the iShares MSCI Italy ETF (NYSE Arca: EWI) before a projected correction.
We suggested that price should break downward to make a new low compared to past years.
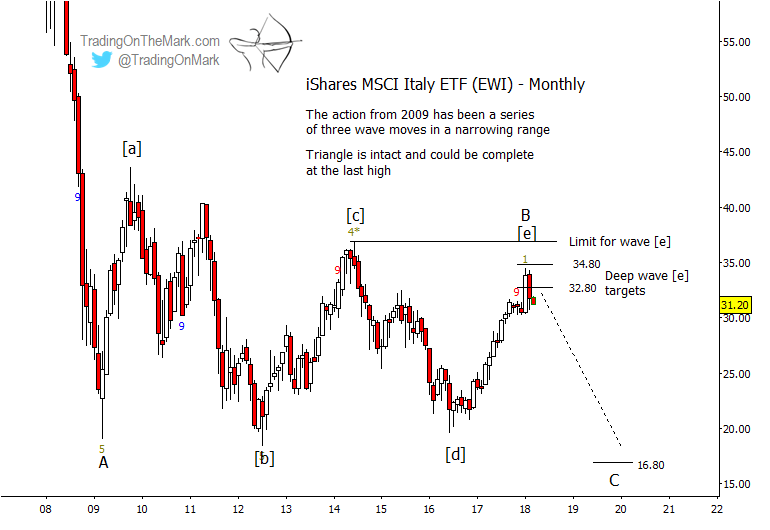
For several years we have been charting what we view as a B-wave triangle – a converging consolidation Elliott wave pattern that has been marking time between the strong decline of 2008-2009 and another strong decline that may begin soon. During the time since we last wrote about it, price has moved as expected to test a resistance zone while tracing the final small waves in the pattern.
The monthly chart below shows how upward wave [e] of the [a]-[b]-[c]-[d]-[e] triangle came close to testing a deep retracement target at 34.80 – a target measured in relation to the prior upward wave [c]. Since wave [c] must not exceed the high of wave [c], there is not much more room for price to rise without calling the triangle scenario into question.
At this point a potentially bearish chart trader would switch to a smaller time frame to estimate whether the upward move appears structurally complete at the price zone where it was expected to finish.
iShares Italy Elliott Wave Forecast – Monthly Chart
Knowing that each leg of an Elliott wave triangle should be corrective and should consist of three sub-waves, we examined the structure of the upward move from the 2016 low. The fact that there have been seven minor up and down swings since the low suggests the move has been corrective. On the weekly chart below, we show what we believe is the most plausible count for a three-wave (a)-(b)-(c) move up from 2016, with wave (c) further divided into five smaller waves as would be expected.
iShares Italy Elliott Wave Forecast – Weekly Chart
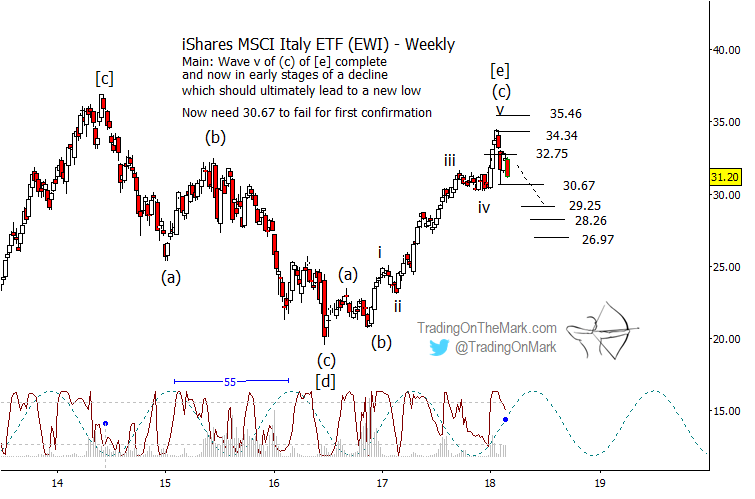
In the time since our previous post, EWI has made a small advance to the 34.34 resistance we had been watching. The advance probably represents minor wave ‘v’ of (c) of [e]. Although we cannot rule out a test of higher resistance near 35.46, it appears more likely the upward pattern segment is complete. On that assumption, we would watch for price to test and soon break through support at 30.67. The resulting cascade should test one or more of the next supports at 29.25, 28.26 and 26.97 in the relatively near term.
Looking for a trader’s edge? Every morning Trading On The Mark presents subscribers with charts for the S&P 500, crude oil, gold, treasuries, the Dollar and the Euro. We emphasize key price areas to watch for turns to commence – check out our subscription plans.
Twitter: @TradingOnMark
No position in any of the mentioned securities at the time of publication. Any opinions expressed herein are solely those of the author, and do not in any way represent the views or opinions of any other person or entity.


