Don’t get bearish too early with Italy ETF
At the start of this year, we posted a moderately bullish update of our contrarian forecast for the iShares MSCI Italy ETF (NYSEARCA:EWI). Since then, the forecast has worked well. Now that price is testing the first major resistance area, it’s time to reassess the trade.
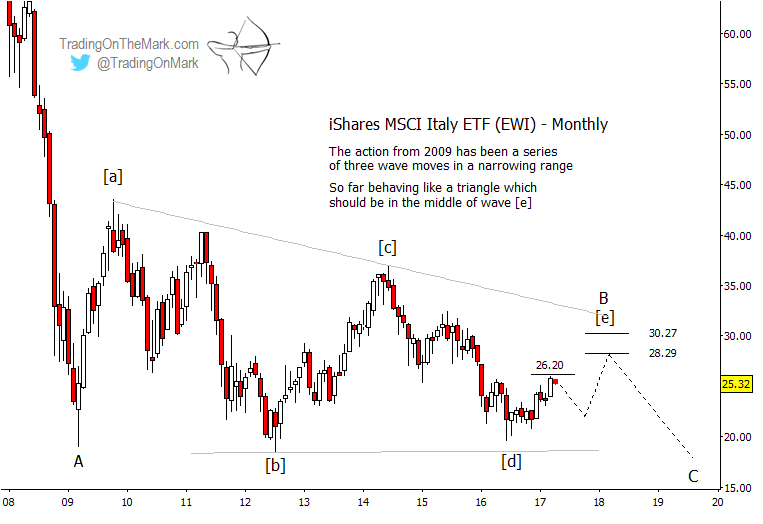
The multi-year pattern in the Italy ETF (EWI) has been one of consolidation, and it counts well as an Elliott wave triangle. The final leg of that triangle probably can reach higher eventually, but it is currently nearing the area where we would expect to see some congestion or a pullback. That suggests that any traders who took advantage of our earlier forecasts might consider locking in profits now. If the final leg of the triangle has more life left in it, there may be another opportunity to try a long trade near the end of 2017.
On a monthly time frame, the Fibonacci 38.2% retracement of wave [d] at 26.20 represents a likely area for momentum to slow. Other Fibonacci retracements of [d] at 28.29 and 30.27 could put a cap on the final leg of wave [e] next year. (However, keep in mind that form allows the possibility that wave [e] could be finished already, and that price could simply break downward out of the triangle from the current area.)
EWI Elliott Wave Price Targets – Monthly Bar Chart
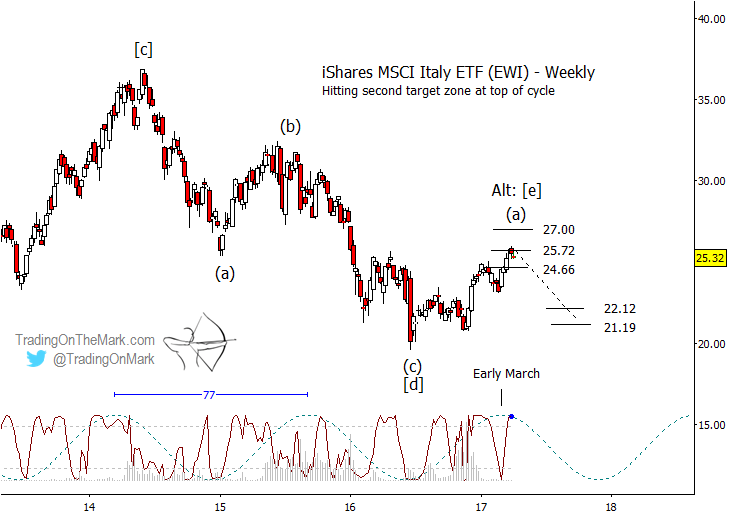
If the rally from last year represents merely the first part of wave [e] of the triangle, as we believe, then the weekly chart highlights some areas where sub-wave (a) of [e] could end and (b) of [e] could begin, near 25.72 or 27.00. The expected (b) subwave has the potential to be choppy, and it might not retrace very far. Thus it probably does not have a high reward potential for any except the most nimble of traders.
If price declines in conjunction with the fresh downward phase of the 77-week cycle shown on the chart, then a low around November or December, perhaps near 22.12 or 21.19, might represent another opportunity to bid in anticipation of a rally.
This month only, we’re offering a great opportunity for you to sign up for any of our services at an even better value, with savings ranging from 17% to 27%! This offer is limited to the first 55 people who sign up, and it won’t be repeated this year. See our subscription services page for details.
EWI Elliott Wave Price Targets – Weekly Bar Chart
ALSO READ: U.S. Dollar Poised To Rise Further In 2017
Twitter: @TradingOnMark
No position in any of the mentioned securities at the time of publication. Any opinions expressed herein are solely those of the author, and do not in any way represent the views or opinions of any other person or entity.


