Looking back and looking forward on the Italy ETF
It was mid-July when we suggested a countertrend trade in the iShares MSCI Italy ETF (NYSEARCA:EWI). Although the economic news out of Italy at that time was mostly bad, we thought the Elliott wave chart pattern offered reasons to expect at least a modest bounce from support. We then revisited EWI in November.
Looking at the converging set of three-wave swings that has printed since 2009, we suggested that a triangle pattern might be in effect. If that is the case, we reasoned, then price should try to form a final upward leg [e] of the triangle before resuming the larger downward trend.
On the monthly chart of iShares Italy ETF (EWI), below, you can see that share price has made an initial attempt at climbing from the support level we identified in July. Price has risen by about 23%. (Maybe it’s fair to call that more than a “modest bounce from support.”)
(Note, during the time since our earlier posts, shares of EWI had a reverse split, making it tricky to compare prices then and now. However the chart pattern and the proportional size of the price swings on the chart are comparable.)
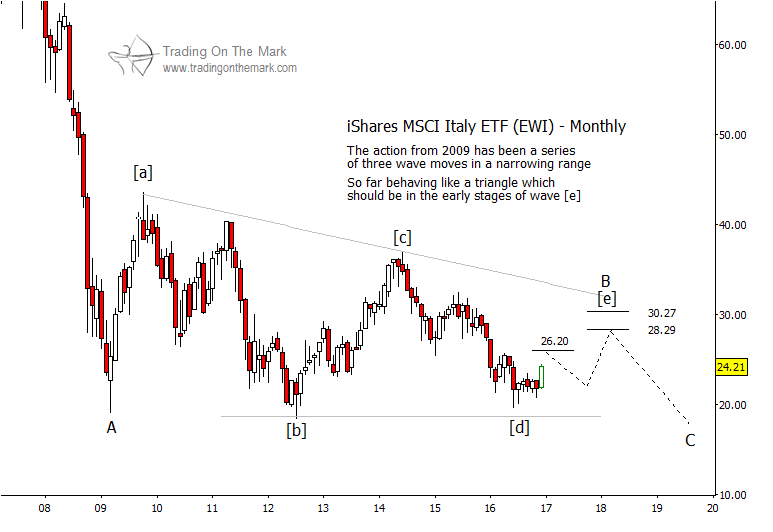
Looking forward, we expect the Italy ETF (EWI) to find initial resistance in near the 26.20 area on a monthly chart. When price eventually recognizes resistance, ideally we should see a decline followed by another attempt to rally. However, keep in mind that the final wave of any triangle can catch traders off guard. The second rally is not guaranteed to happen.
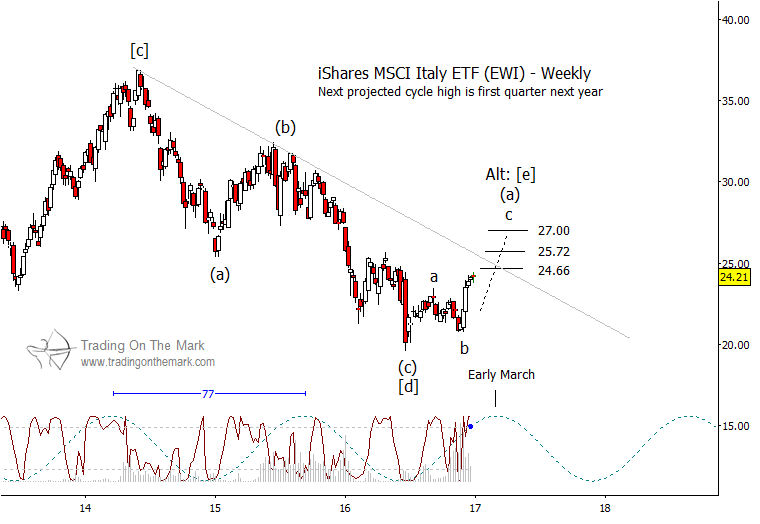
The weekly chart provides more detail and allows us to refine our calculations of the areas to watch as resistance. The price of EWI is already near a test of the 24.66 area, which may also coincide with a test of the trend line shown. If price breaks above the first resistance area, then 25.72 represents the next most achievable target, and 27.00 represents a “stretch target.”
The weekly chart also shows why it may be dangerous to assume that a second rally can take place later in 2017. There is already a three-wave structure visible in the climb from July 2016. The structure could represent sub-wave (a) of larger wave [e] of the triangle, or it could represent the entirety of wave [e]. Meanwhile, the dominant 77-week cycle suggests that price should seek a high in early March 2017, and that might represent the conclusion of wave [e]. There is no way to be certain ahead of time.
Traders who jumped onto the rally after the July low should consider taking profits soon. Skilled traders might even find opportunities for short trades on the iShares Italy ETF later this year.
These are the kinds of opportunities we cover frequently for subscribers at our website. The technical methods work for traders on all time frames, ranging from intraday charts to monthly charts. Check out Trading On The Mark and see how our daily or intraday services can enhance your trading.
Twitter: @TradingOnMark
No position in any of the mentioned securities at the time of publication. Any opinions expressed herein are solely those of the author, and do not in any way represent the views or opinions of any other person or entity.


: Showing Some Signs of Emerging Strength")
